AAVE and GRT Altcoin Analysis for November 29, 2023

Bitcoin is maintaining its upward trend, with a current target of surpassing its annual high above $38,400. This update provides an analysis of the market situation for the alternative coins Aave (AAVE) and The Graph (GRT) as of Wednesday, November 29.
Aave (AAVE)
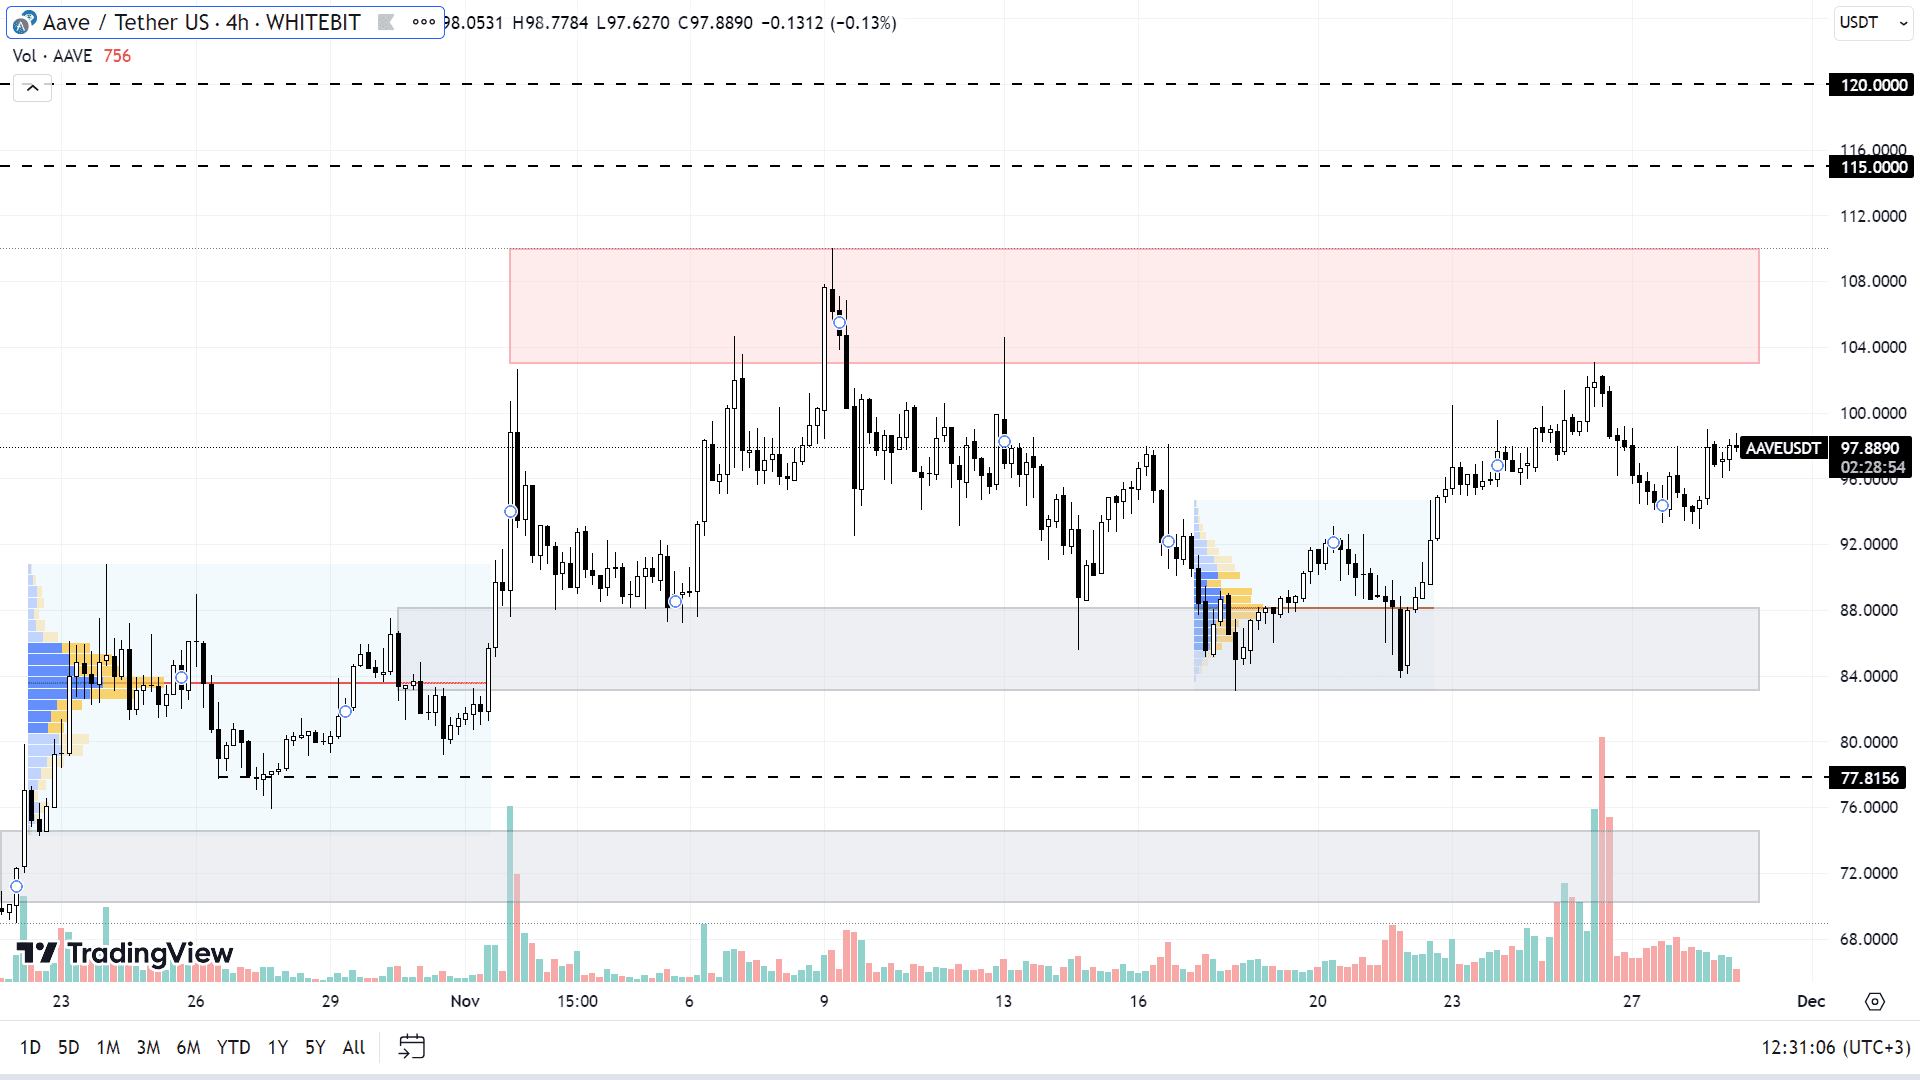
The upward trend for AAVE continues, albeit with a slowdown in growth over the past week. A key challenge for buyers lies in the resistance zone between $103 and $110, which has been tested five times within a month but remains unbroken.
For AAVE, the goal is to sustain its growth and set new annual highs. Should it break through the current resistance zone, the next significant levels that could potentially impede its ascent are situated at $115 and $120. The momentum of this growth will largely depend on the buying activities in BTC.
If a market correction occurs, the AAVE price could see a considerable decline. The initial target during such a correction would be the buying zone at $83-$88. Further down lies a resistance level at $77.8 and a range between $70.2 and $74.5. These levels are expected to be tested if there's a significant correction in BTC, possibly down to around $32,000.

AAVE chart on the H4 timeframe
The Graph (GRT)
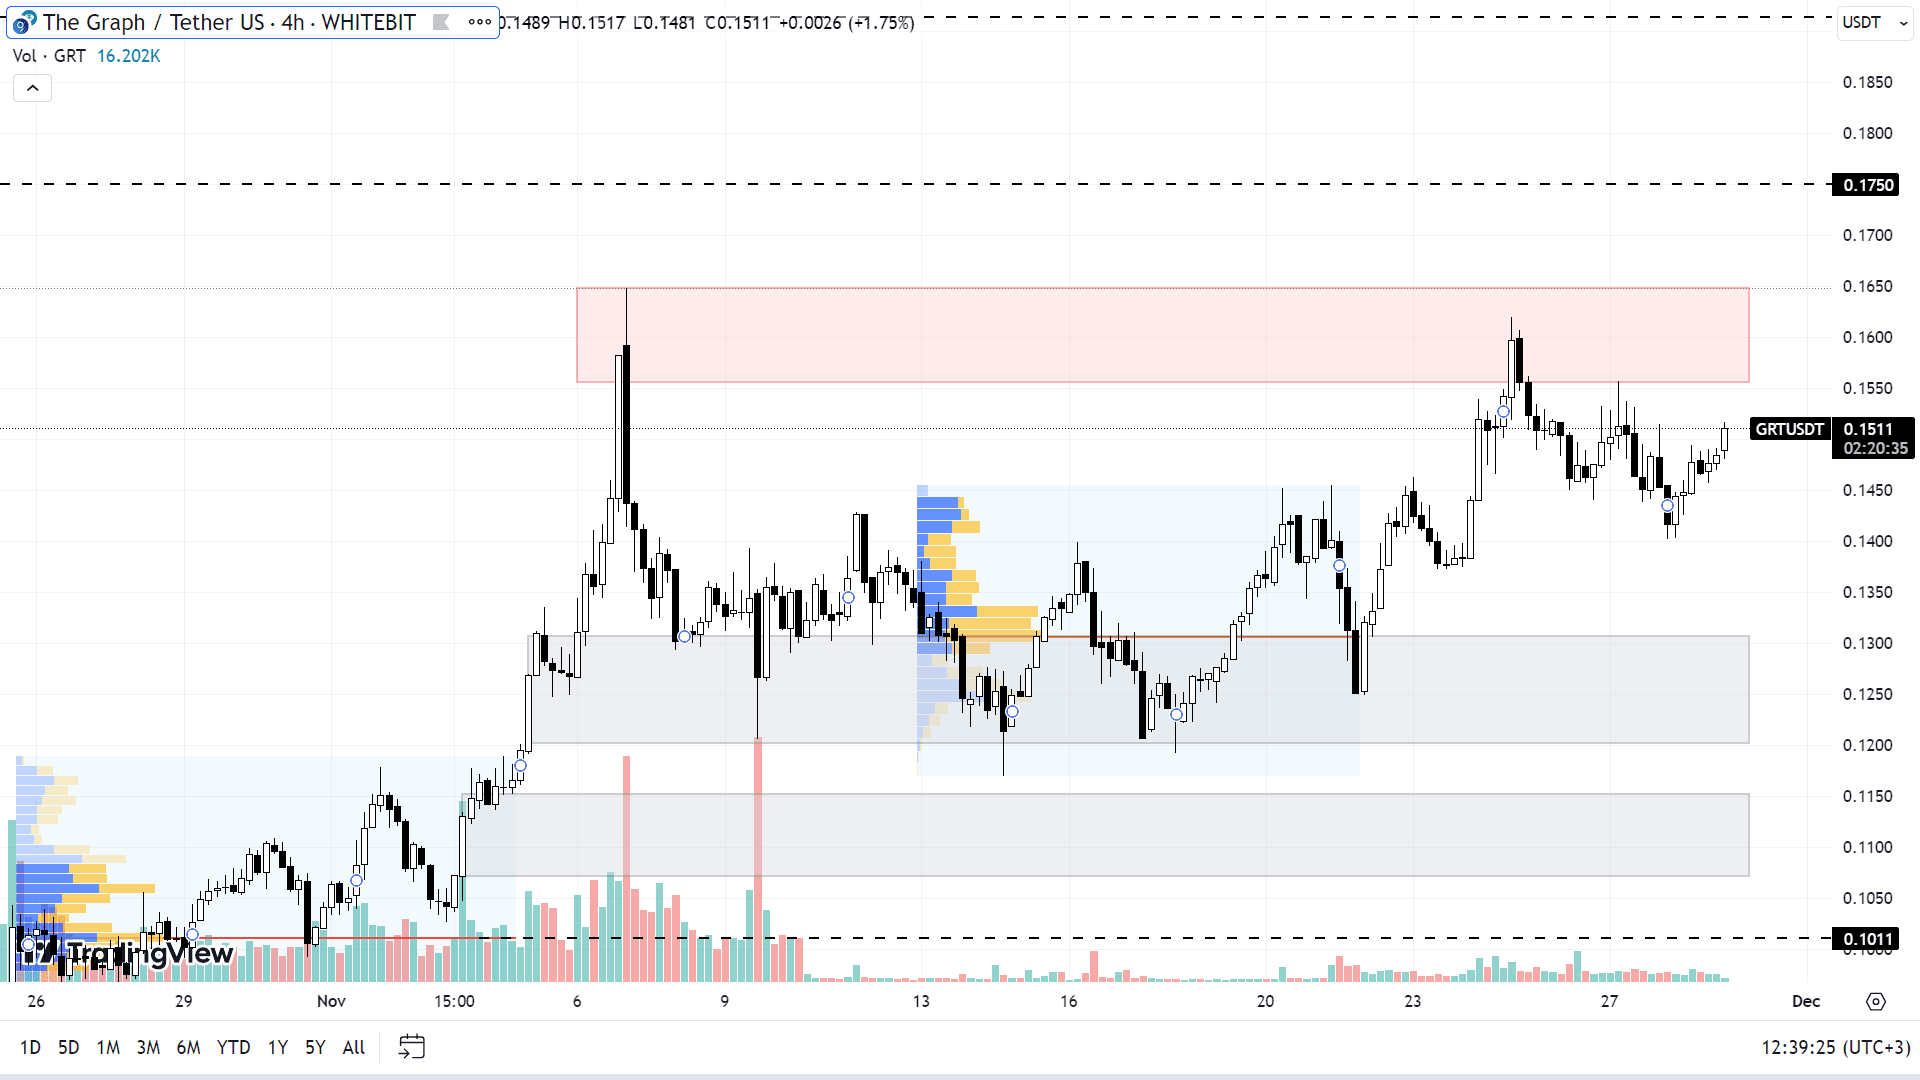
In the past one and a half months, GRT increased by 110%, primarily due to the positive trajectory of Bitcoin (BTC). Despite this surge, GRT has not yet reached its yearly high, which is 52% higher than its current price, sitting at the $0.23 mark.
The primary outlook for GRT, similar to many other altcoins, is to continue its upward trend. If it can break through the selling zone of $0.155-$0.165, the next targets for buyers would be around $0.17 and $0.19.
A market correction remains a plausible scenario, given the lack of significant downturns in Bitcoin's chart recently. Under such circumstances, GRT could potentially test support zones at $0.120-$0.130, $0.107-$0.115, and $0.101. These points might present good opportunities for accumulating the asset in the spot market, particularly if BTC stays above the critical $30,000 level.

GRT chart on the H4 timeframe
Check out GNcrypto for the latest cryptocurrency rates and chart analysis.
Disclaimer
Please note that the analysis provided above should not be considered a trading recommendation. Before opening any deals, we strongly advise conducting your own research and analysis.
Abbreviations
TF (Timeframe) — a chronological period equal to the time it takes to form one Japanese candle on the chart.
Horizontal channel (flat, sideways, range) — the price movement between support and resistance levels, without going beyond the given range.
К — simplified designation of one thousand dollars of the asset price (for example, 23.4K – $23,400).
Gray range on the chart — a support zone.
Red range on the chart — a resistance zone.
Correlation — the tendency of prices of different cryptocurrencies to move in sync, often influenced by the dominance of one of the assets.
Initial materials
This analysis was informed by the following educational materials and articles from GNcrypto:

