ADA and BCH Altcoin Analysis for November 22, 2023

Here's a review of the market situation for Cardano (ADA) and Bitcoin Cash (BCH) as of Wednesday, November 22.
Bitcoin experienced a slight correction last night, dropping to around $35,700. However, the overall trend for BTC remains consistent with our previous analysis.
Cardano (ADA)
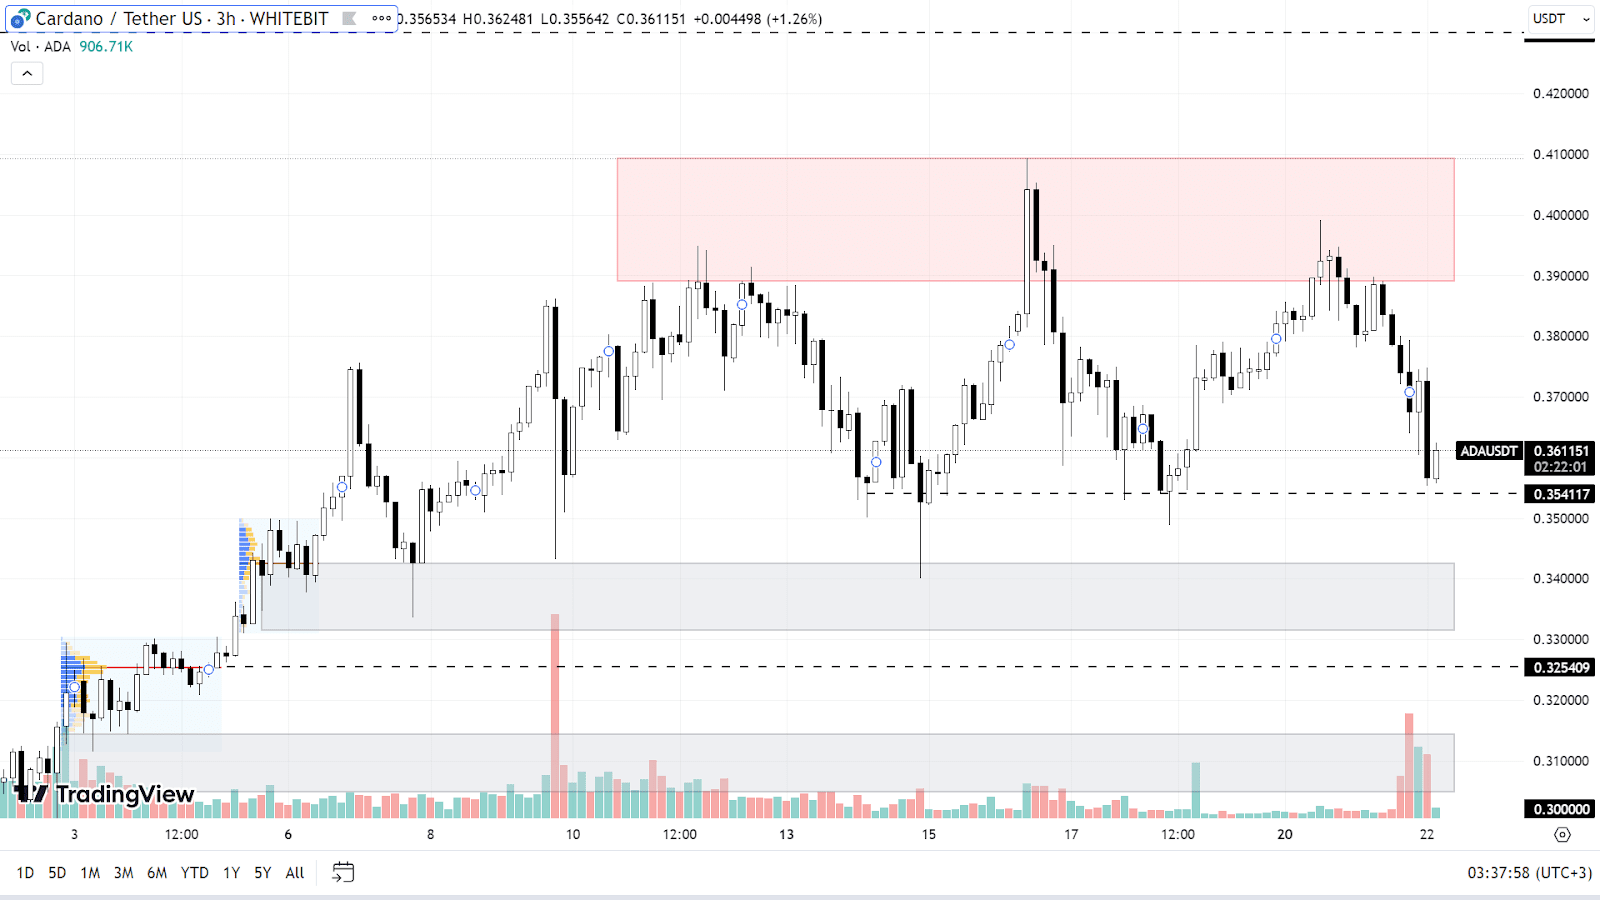
Cardano is currently trading between a support level of $0.354 and a resistance zone of $0.39-$0.41. This price range has been tested three times over the past two weeks.
If Bitcoin continues its upward trend, the next goal for Cardano would be to reach new highs. In this scenario, ADA could break through the current resistance zone and test the $0.43 level. A subsequent stabilization of its price within the $0.41-$0.43 range is a likely outcome.
On the other hand, should Bitcoin undergo a correction, Cardano might drop to support zones around $0.330-$0.342, $0.325, and $0.305-$0.315. Further declines in ADA's value would largely depend on the trajectory of Bitcoin's price movement.

ADA chart on the H3 timeframe
Bitcoin Cash (BCH)
The performance of Bitcoin Cash (BCH) has been somewhat restrained since Bitcoin's rise began in mid-October. The asset only grew by about 25% over the month, but this growth has already been negated.
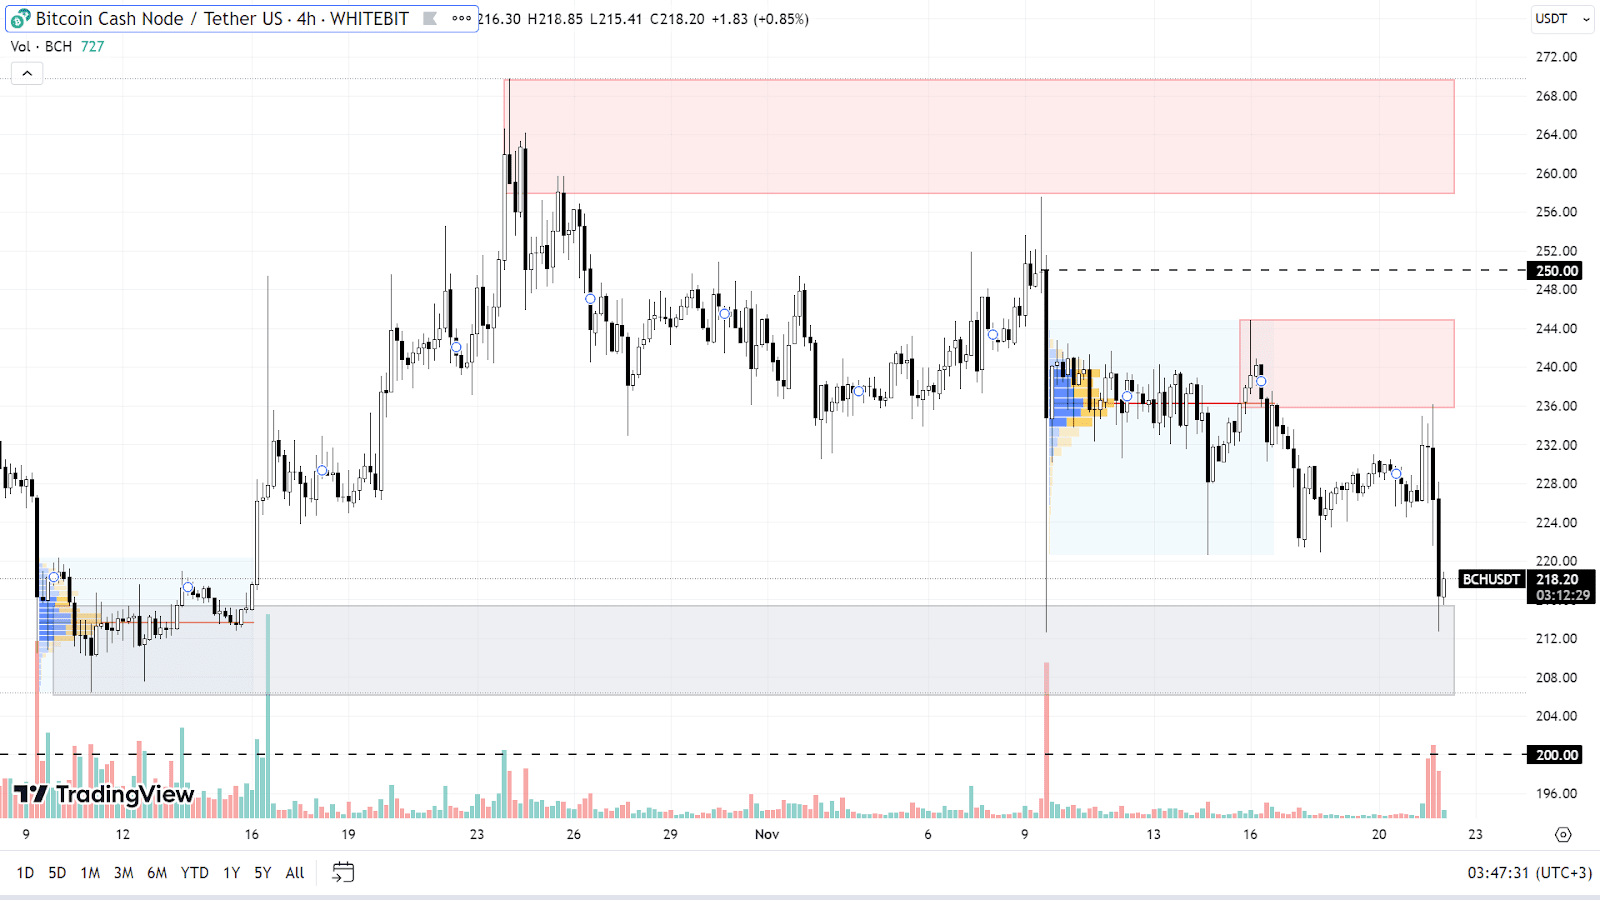
Currently, BCH is on a downward trend, trading within the support zone of $206-$215. This is the same range from which BCH started its upward journey on October 16. If Bitcoin continues its correction, BCH might set new local lows. The first target for sellers would be the psychological level of $200.
For BCH to start an upward movement, buyers need to show strength and break through the resistance zone between $235-$245 with significant trading volume. The next challenges for growth would be at the $250 level and then within the seller's range of $258-$270. Overall, in its current state, BCH doesn't seem to be an attractive option for spot buying, so it might be prudent to avoid long positions for now.

BCH chart on the H4 timeframe
Check out GNcrypto for the latest cryptocurrency rates and chart analysis.
Disclaimer
Please note that the analysis provided above should not be considered a trading recommendation. Before opening any deals, we strongly advise conducting your own research and analysis.
Abbreviations
TF (Timeframe) — a chronological period equal to the time it takes to form one Japanese candle on the chart.
Horizontal channel (flat, sideways, range) — the price movement between support and resistance levels, without going beyond the given range.
К — simplified designation of one thousand dollars of the asset price (for example, 23.4K – $23,400).
Gray range on the chart — a support zone.
Red range on the chart — a resistance zone.
Correlation — the tendency of prices of different cryptocurrencies to move in sync, often influenced by the dominance of one of the assets.
Initial materials
This analysis was informed by the following educational materials and articles from GNcrypto:
Recommended

