ADA and ETC: Altcoin Analysis for October 18, 2023

Bitcoin continues trading above the $28,500 mark, with its landscape unchanged since yesterday's review. Let’s explore the market dynamics of cryptocurrencies Cardano (ADA) and Ethereum Classic (ETC) as of October 18.
Cardano (ADA)
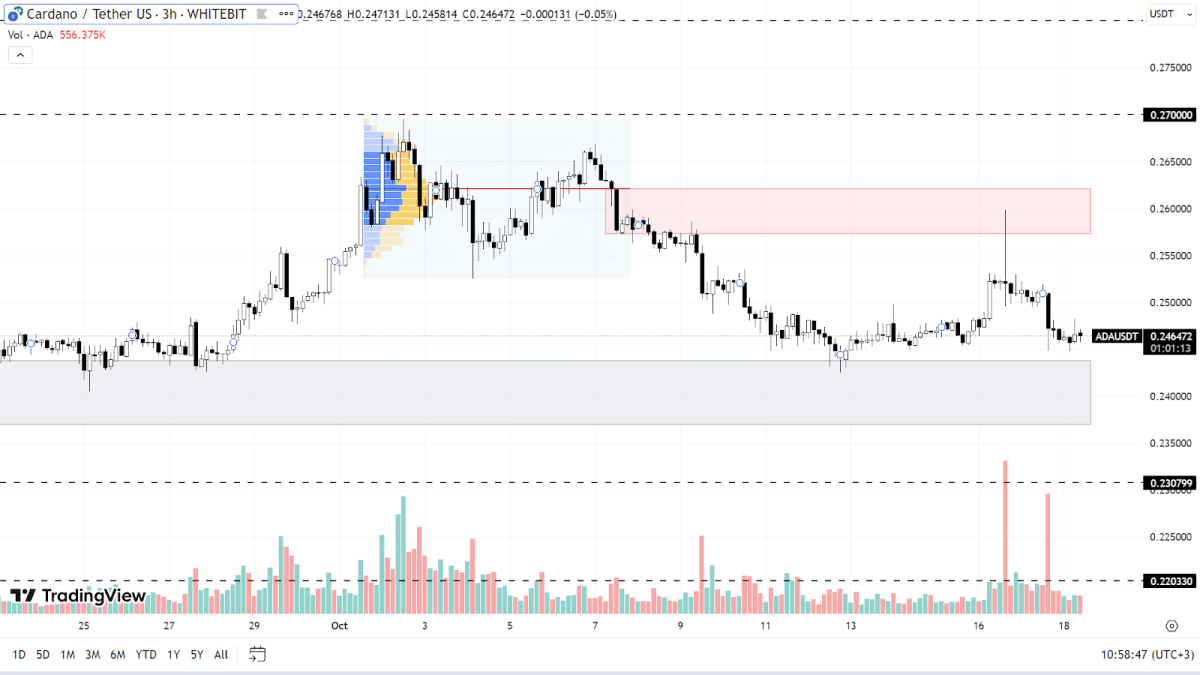
For the past two months, Cardano has been trading sideways, bounded by the support zone of $0.236-$0.243 and the resistance zone of $0.257-$0.242. With neither buyers nor sellers gaining a clear edge, the ADA price largely reflects the broader crypto market's sentiment.
Should the negative sentiment around BTC persist, ADA might hit a new local low and test the support levels at $0.23 and $0.22, both established during its decline on July 10.
On the flip side, Cardano's ascent seems capped for now, given the extensive overhead resistance. Beyond the immediate hurdle, barriers loom at $0.27 and $0.28. Higher still, resistance stands firm at $0.29 and $0.30. Surpassing these would necessitate a significant market uplift and reinvigorated buyer interest.

ADA chart on the H3 timeframe
Ethereum Classic (ETC)
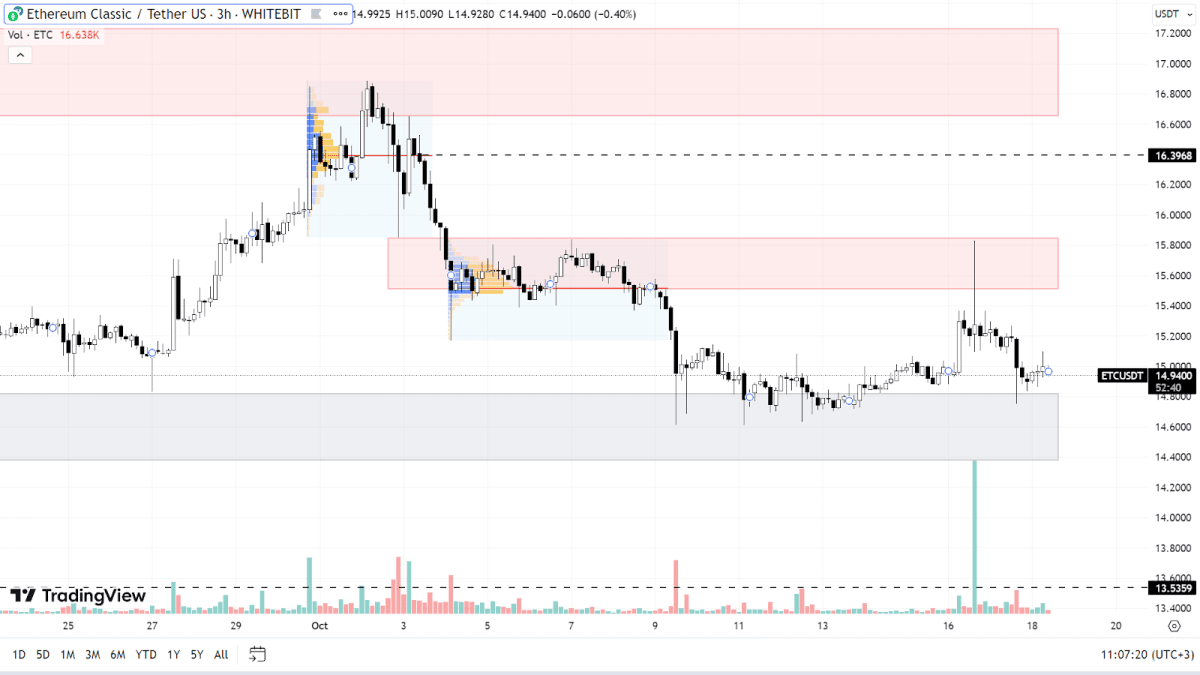
The market dynamics for ETC closely resemble those of Cardano. The coin is currently trading within a flat range, supported between $14.38 and $14.31 while facing resistance from $15.51 to $15.84. With the prevailing low volatility, neither the buyers nor the sellers seem poised to dictate the future trajectory.
If Bitcoin's decline continues, ETC could breach its current support and aim for local lows at $13.53 and $12.67. However, a plunge to its year's low within this bearish trend seems unlikely at the moment.
For an upward shift in Ethereum Classic's trajectory, the coin must establish itself above its current resistance levels. Moreover, it would need to surpass resistance at $16.4 and within the $16.65-$17.23 range. A decisive end to the downtrend can only be confirmed once ETC surpasses $18.

ETC chart on the H3 timeframe
Today, several significant economic data points are set to be released, including the US building permits count and crude oil inventory levels. Given the impact these metrics can have on the US dollar, and by extension on cryptocurrency valuations, traders need to factor this into their strategies for the day.
Check out GNcrypto for the latest cryptocurrency rates and chart analysis.
Disclaimer
Please note that the analysis provided above should not be considered a trading recommendation. These are solely the opinions of the GNcrypto editorial board regarding the market situation. Before opening any deals, we strongly advise conducting your own research and analysis.
Abbreviations
TF (Timeframe) — a chronological period equal to the time it takes to form one Japanese candle on the chart.
Horizontal channel (flat, sideways, range) — the movement of price between support and resistance levels, without going beyond the given range.
К — simplified designation of one thousand dollars of the asset price (for example, 23.4K – $23,400).
Gray range on the chart — a support zone.
Red range on the chart — a resistance zone.
Correlation — the tendency of prices of different cryptocurrencies to move in sync, often influenced by the dominance of one of the assets.
Initial materials
This analysis was informed by the following educational materials and articles from GNcrypto:
Recommended

