ADA and TRX: Altcoin Analysis for December 20, 2023

As Bitcoin remains within its previously analyzed range, this update focuses on the current market dynamics of altcoins Cardano (ADA) and Tron (TRX) as of December 20, 2023.
Cardano (ADA)
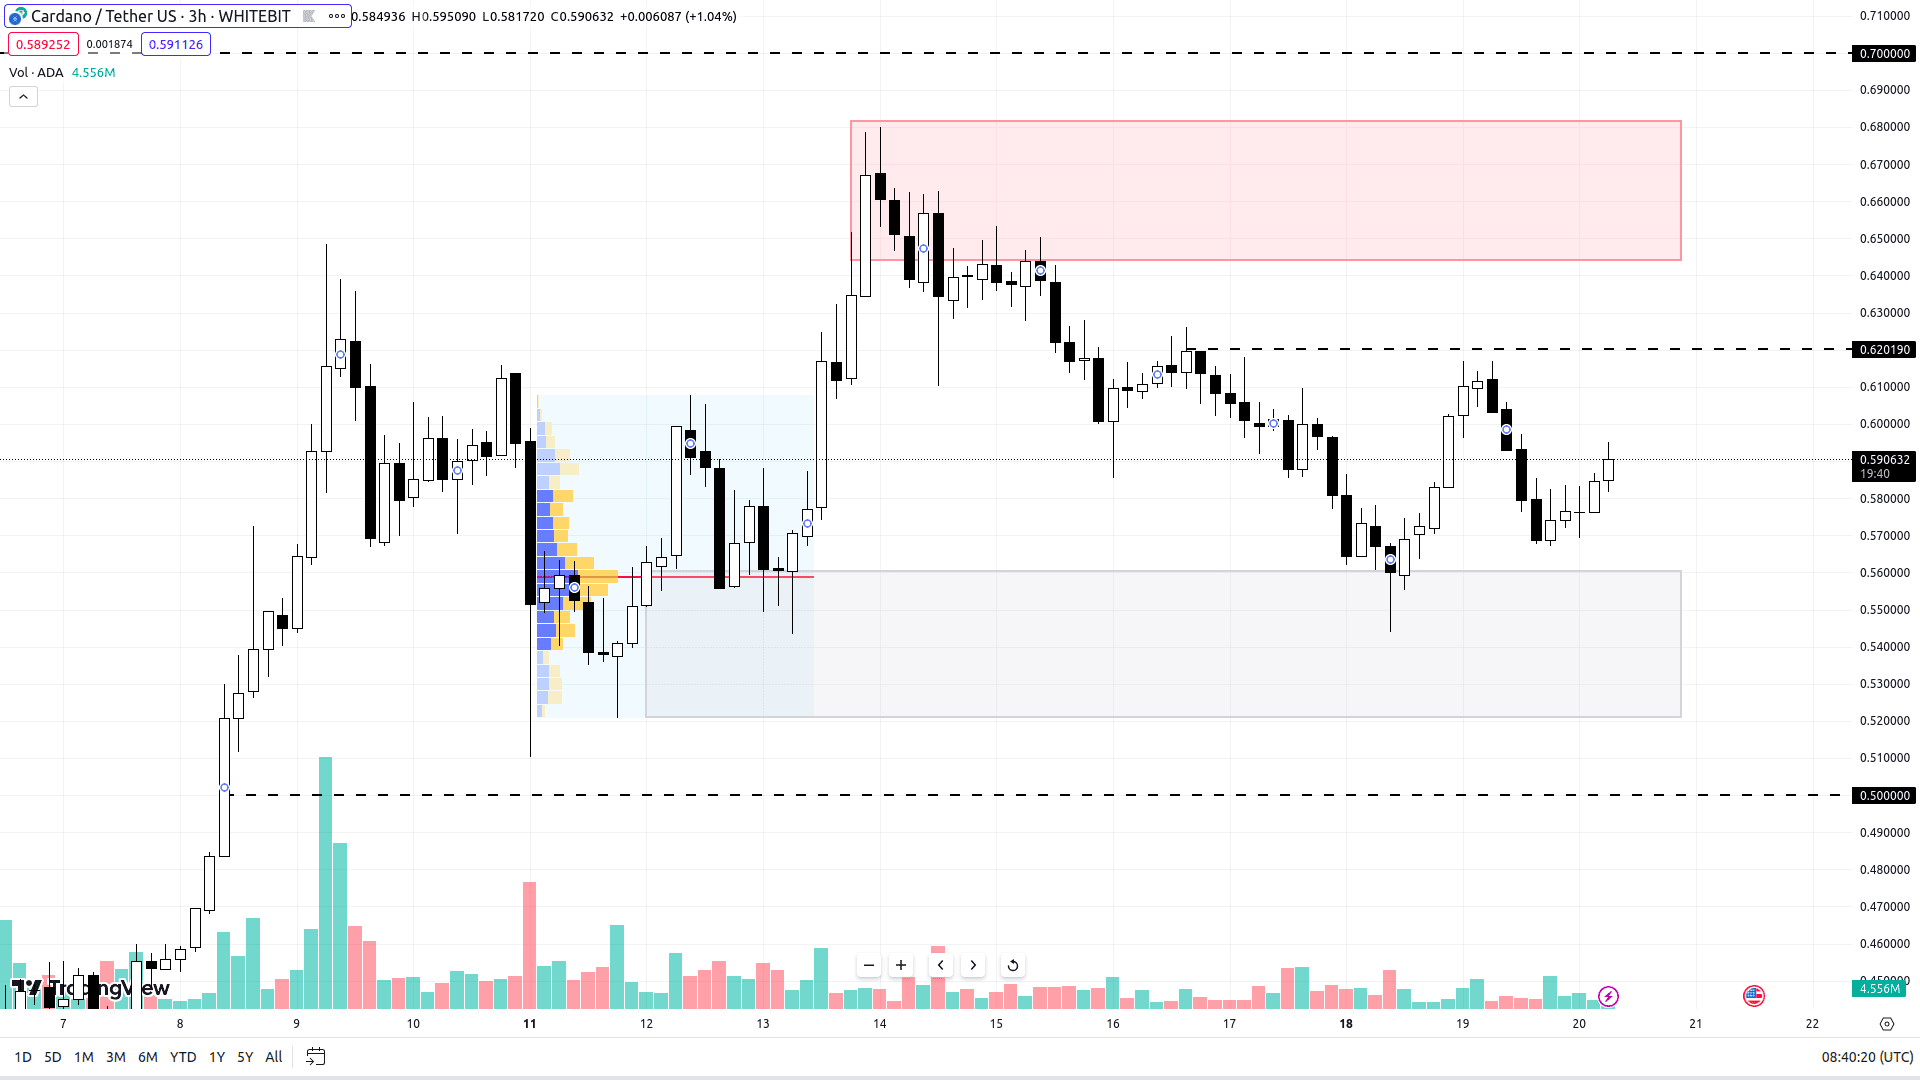
Although ADA experienced a 78% increase in December 2023, its growth has somewhat plateaued. The asset has been trading sideways for the past two weeks, hovering between a support zone of $0.52–$0.56 and a resistance range of $0.64–$0.68.
With Bitcoin's bullish trend, ADA's continued rise seems likely. A key resistance level at $0.62 stands in its way, but surpassing this could lead to a potential surge towards $0.7.
Conversely, ADA could face a deeper correction if Bitcoin’s chart reflects a downturn. In such a scenario, Cardano might retest its existing support zone and possibly probe the psychological level of $0.5.

ADA chart on the H3 timeframe
Tron (TRX)
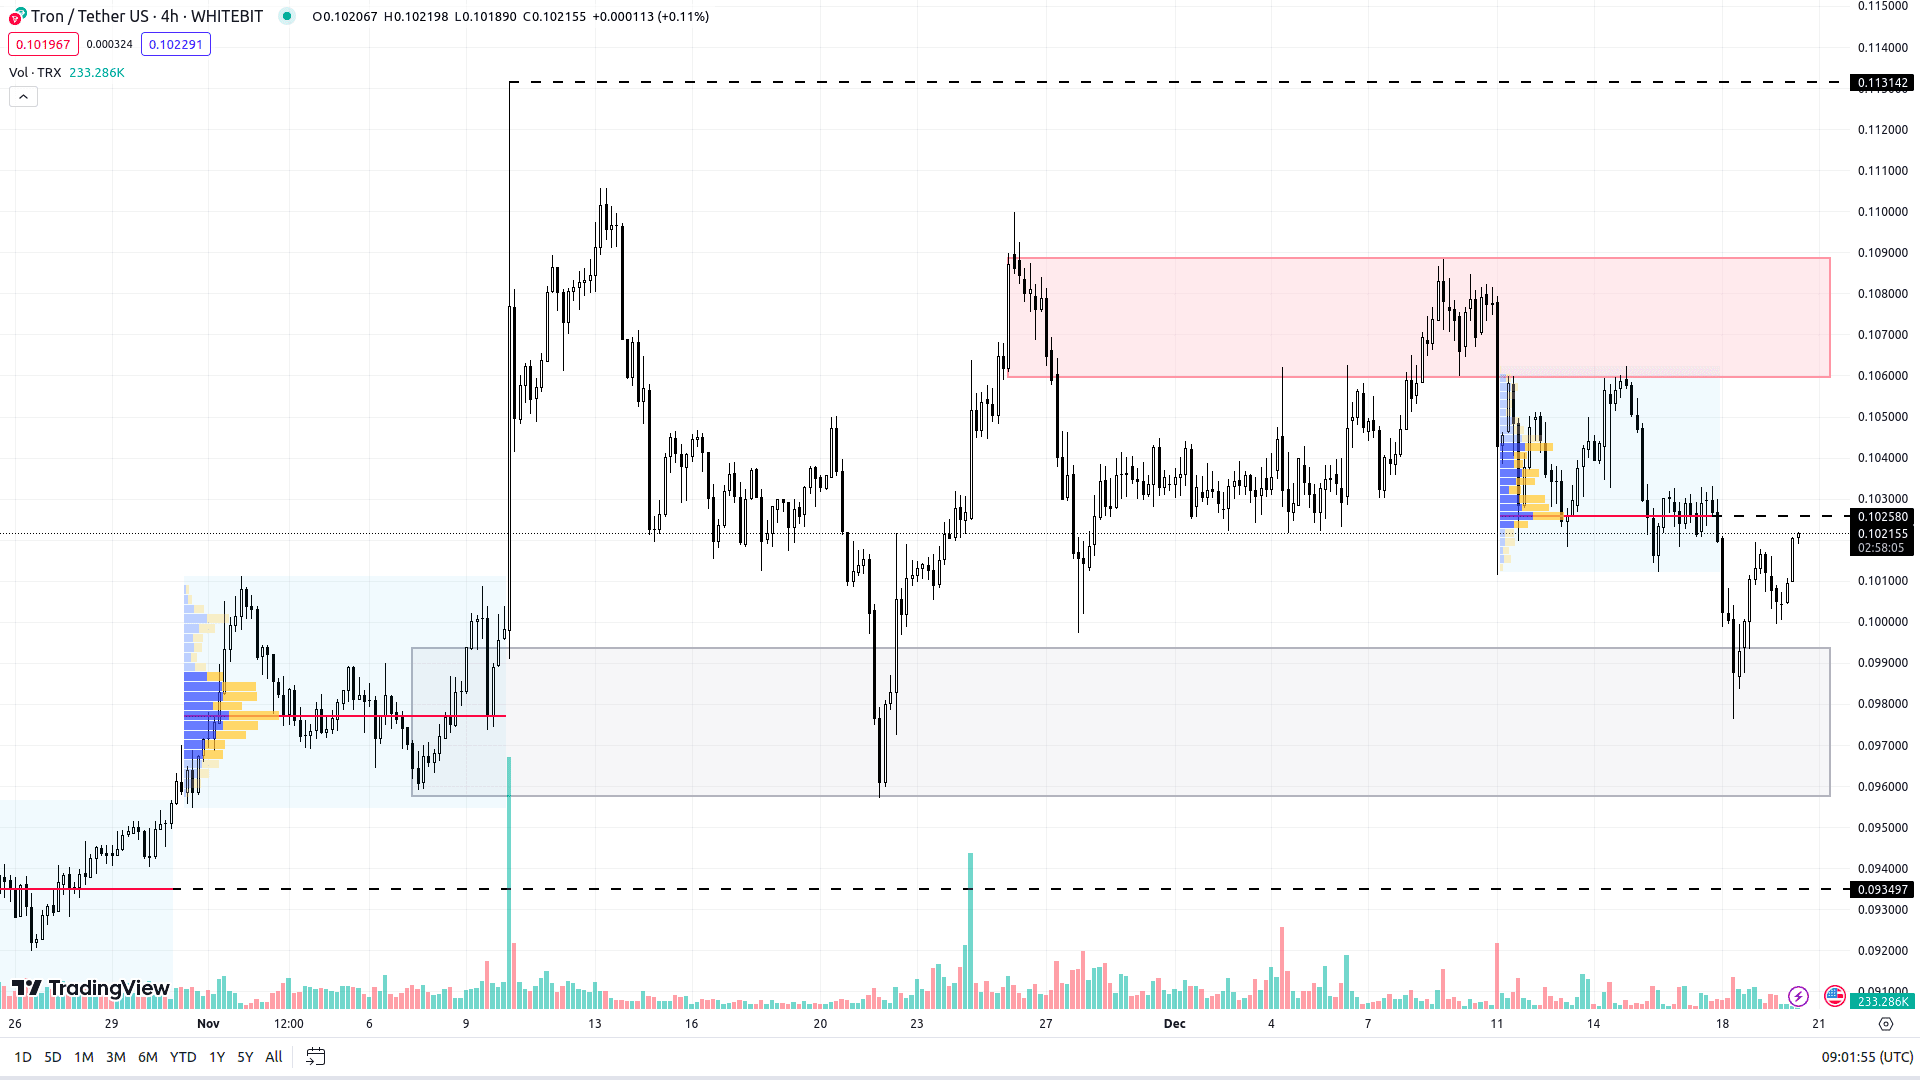
TRX has been stuck in a month-long sideways movement, failing to surpass its last high of $0.113. Since then, Tron has been in a gradual decline.
The asset is currently trading near a support zone of $0.095–$0.099. For an upward trajectory, TRX needs to breach and hold above the $0.102 resistance level. Achieving this would set its next target in the $0.105–$0.108 zone, just above its local peaks of $0.110 and $0.113.
A negative turn in Bitcoin’s performance could adversely impact TRX. Under these circumstances, Tron might test the $0.093 level, with a fall below this indicating a potential extension of the downtrend.

TRX chart on the H4 timeframe
Check out GNcrypto for the latest cryptocurrency rates and chart analysis.
Disclaimer
Please note that the analysis provided above should not be considered a trading recommendation. Before opening any deals, we strongly advise conducting your own research and analysis.
Abbreviations
TF (Timeframe) — a chronological period equal to the time it takes to form one Japanese candle on the chart.
Horizontal channel (flat, sideways, range) — the price movement between support and resistance levels, without going beyond the given range.
К — simplified designation of one thousand dollars of the asset price (for example, 23.4K – $23,400).
Gray range on the chart — a support zone.
Red range on the chart — a resistance zone.
Correlation — the tendency of prices of different cryptocurrencies to move in sync, often influenced by the dominance of one of the assets.
Initial materials
This analysis was informed by the following educational materials and articles from GNcrypto:

