ADA and TRX Altcoin Analysis for October 27, 2023

Bitcoin has been trading sideways for three days, and volatility on its chart remains low. Here’s a market overview of the altcoins Cardano (ADA) and Tron (TRX) as of Friday, October 27.
Cardano (ADA)
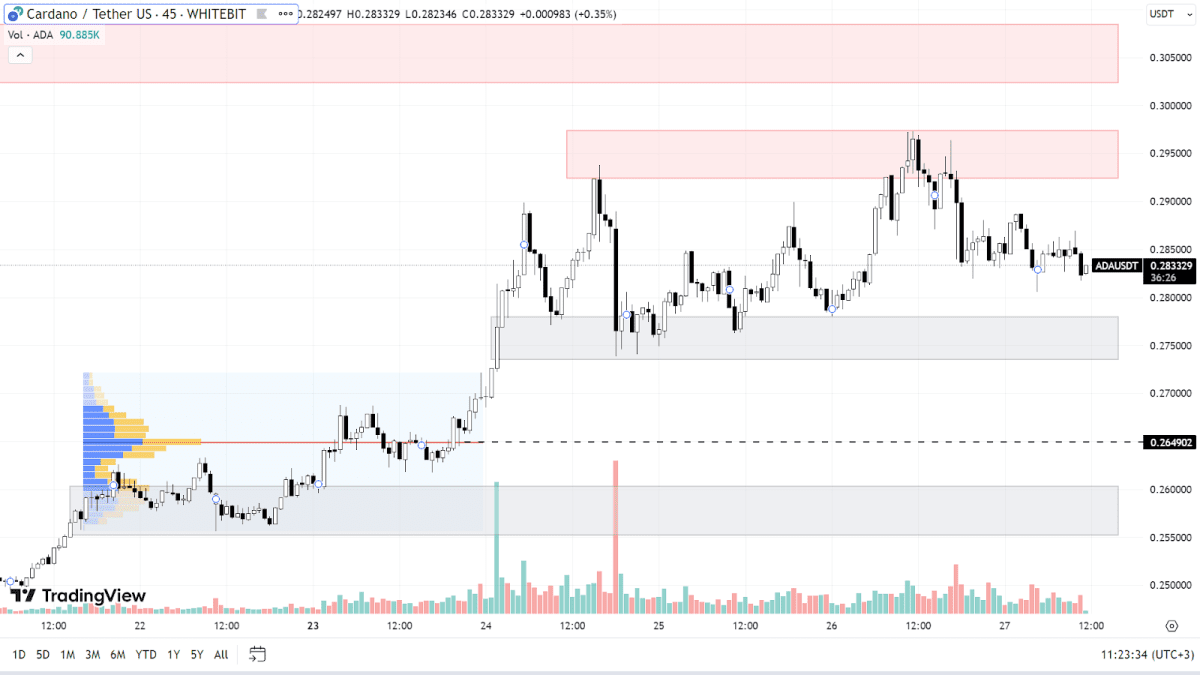
The local trend on Cardano's chart is bullish, a trend that seems logical given the positive dynamics of BTC. Currently, ADA is trading between the support zone of $0.2730-$0.2770 and the resistance of $0.2920-$0.2970.
The priority for ADA is to continue this upward movement. Above the current resistance zone, the range of $0.302-$0.308 becomes the next target for buyers. Future highs are expected to be updated as Bitcoin continues its growth.
In the event of a correction, the ADA price may test the support levels at $0.265 and within the range of $0.255-$0.260. All these marks are within the upward trend, which is expected to resume after such a correction.

ADA chart on the M45 timeframe
Tron (TRX)
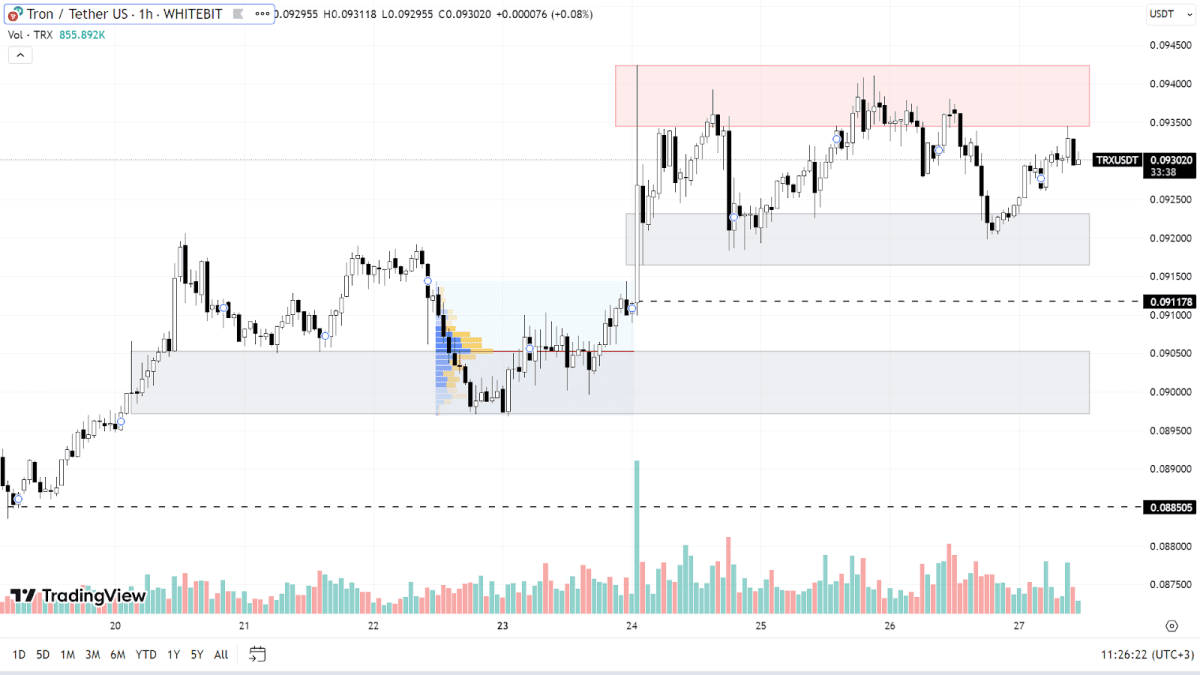
Unlike the majority of altcoins, TRX began its upward trend even before Bitcoin surpassed its annual high. Currently, TRX is trading at around $0.094, marking the asset's highest price point in the last two years.
Given the ongoing positive dynamics of BTC, a continuation of this growth trend is anticipated. The last time Tron reached these heights was two years ago, rendering the old resistance levels irrelevant. After surpassing the resistance zone of $0.093-$0.094, potential next targets for buyers could be the $0.097 mark and the psychological level of $0.1.
In the event of a correction, the TRX price could fall to $0.091 and enter the buyer's zone between $0.0890-$0.0905. Below that, the support level at $0.0885 could also be tested, without posing a threat to the prevailing uptrend.

TRX chart on the H1 timeframe
Cryptocurrency markets typically experience minimal volatility over the weekends, and this occasion is expected to be no different.
Check out GNcrypto for the latest cryptocurrency rates and chart analysis.
Disclaimer
Please note that the analysis provided above should not be considered a trading recommendation. Before opening any deals, we strongly advise conducting your own research and analysis.
Abbreviations
TF (Timeframe) — a chronological period equal to the time it takes to form one Japanese candle on the chart.
Horizontal channel (flat, sideways, range) — the price movement between support and resistance levels, without going beyond the given range.
К — simplified designation of one thousand dollars of the asset price (for example, 23.4K – $23,400).
Gray range on the chart — a support zone.
Red range on the chart — a resistance zone.
Correlation — the tendency of prices of different cryptocurrencies to move in sync, often influenced by the dominance of one of the assets.
Initial materials
This analysis was informed by the following educational materials and articles from GNcrypto:
Recommended

