ADX indicator

What is the ADX indicator and how to use it? How to identify a trend and how to measure its strength using the ADX indicator?
"If you want to make money, follow the trend!" an old trading saying.
What is the ADX indicator?
Many traders use trend trading strategies. How to visually determine the trend? Everything is straightforward. When the price rises, the trend goes up, and when the price falls, the trend goes down. American engineer John Welles Wilder Jr. developed the Average Directional Index (ADX) to determine the trend strength. It was described in 1978 in his book New Concepts in Technical Trading Systems, along with the RSI (Relative Strength Index), ATR (Average True Range), and Parabolic SAR indicators.
The ADX indicator, the average directional movement index, is an oscillator whose values vary from 0 to 100. The indicator rarely drops below 10 and usually stays under 60. If the indicator line is above 25, there is a strong market trend; if the volatility decreases, the curve crosses the 25 mark from top to bottom.
The ADX indicator is the standard technical analysis tool for traders on many platforms. It works on traditional, cryptocurrency, and other markets. It can be used on any timeframes.
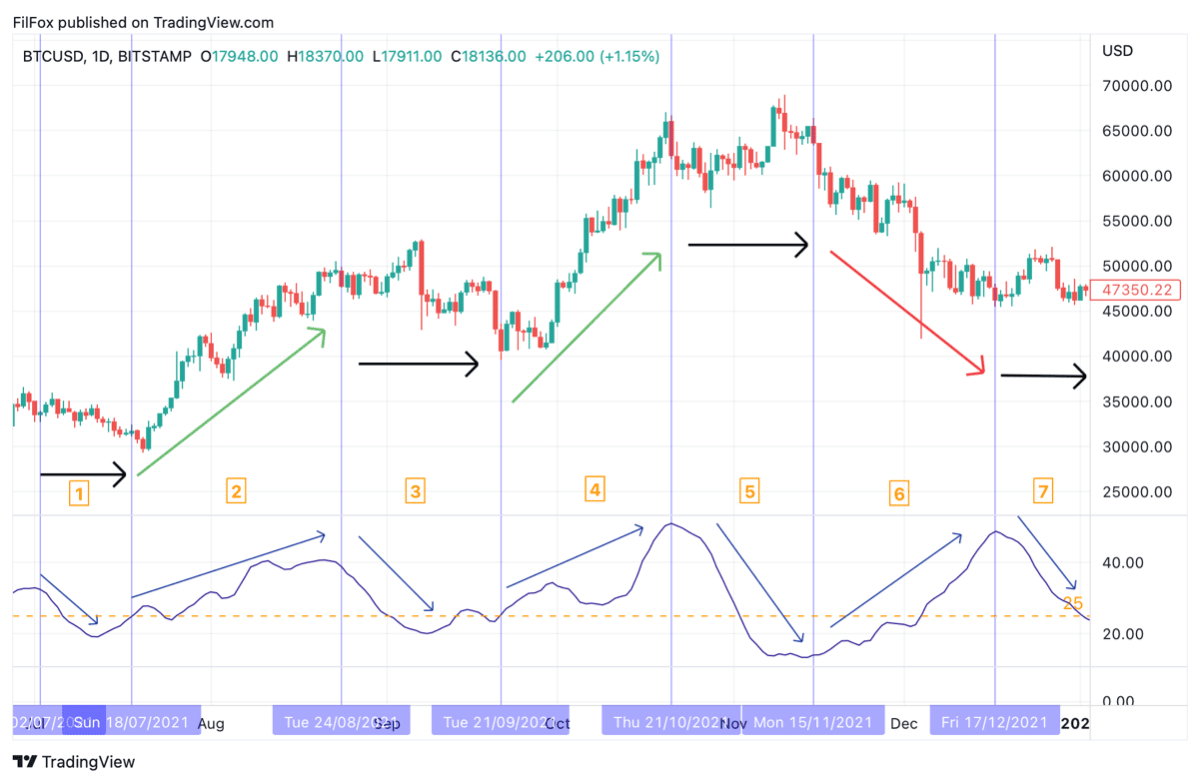
The indicator is located at the bottom of the price chart and is marked in blue. By the way, the color can be selected in the indicator settings.
In the first section, we see the ADX drops below the orange 25 mark while the asset's volatility is very low.
In the second and fourth sections, volatility is growing, an uptrend is expressed in the market, while the value of the oscillator is growing, and the blue curve line crosses the orange level 25 from the bottom up.
When the uptrend weakens, the value of the oscillator decreases.
In the fifth section, you can see how the price reaches its maximum value, and the ADX indicator shows the weakness of the uptrend and warns of its end.
In the sixth section, a powerful downtrend begins, shown by the indicator, the value of which is close to 50.
The price is moving sideways in the seventh section of the chart, so the indicator line is falling.
We see that the ADX indicators are significantly late, but in the fifth section, we received a warning about the weakness of the uptrend.
The disadvantages of the indicator are:
- delay in indicators;
- more information on long and medium time frames;
- no signal for a sudden trend change.
Benefits include:
- use in any markets and time frames;
- setting the sensitivity of the indicator;
- automatic accounting of market volatility.
Setting up and using the ADX indicator in trading
Typically, traders identify a trend using the ADX indicator and then look for entry points to the market.
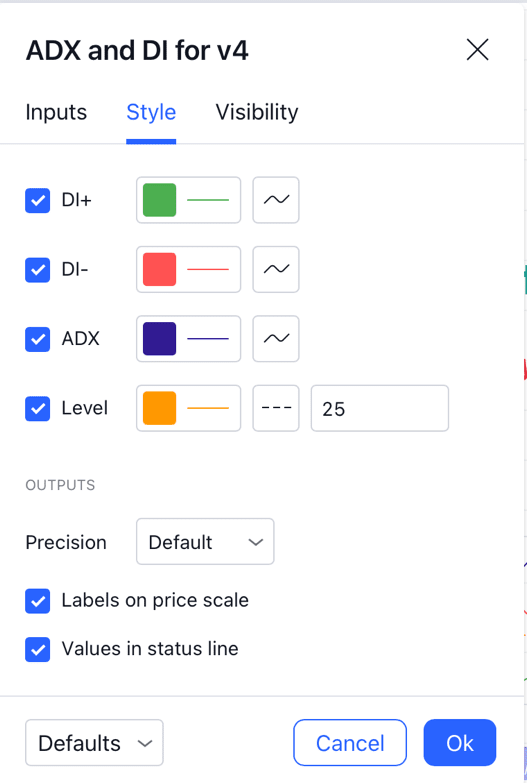
A modification of the ADX indicator is used with the visualization of additional DI+ and DI- curves to determine the entry and exit points of trading positions. To do this, check the corresponding checkboxes in the indicator settings.
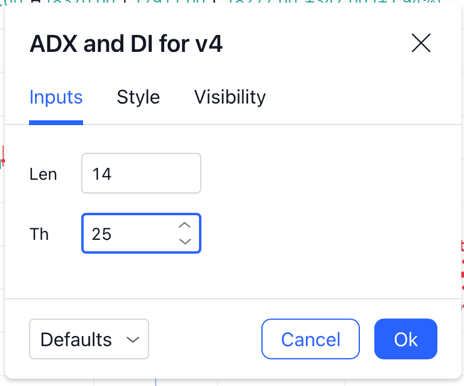
In the Inputs tab, you need to specify the smoothing period. It is set to 14 by default.
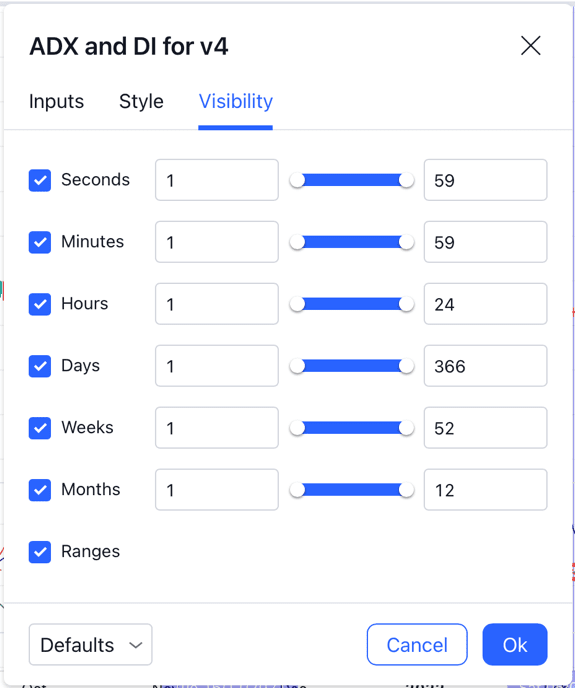
On the Visibility tab, checkboxes are used to select the timeframes where the indicator will be displayed.
After that, the indicator will look like this:
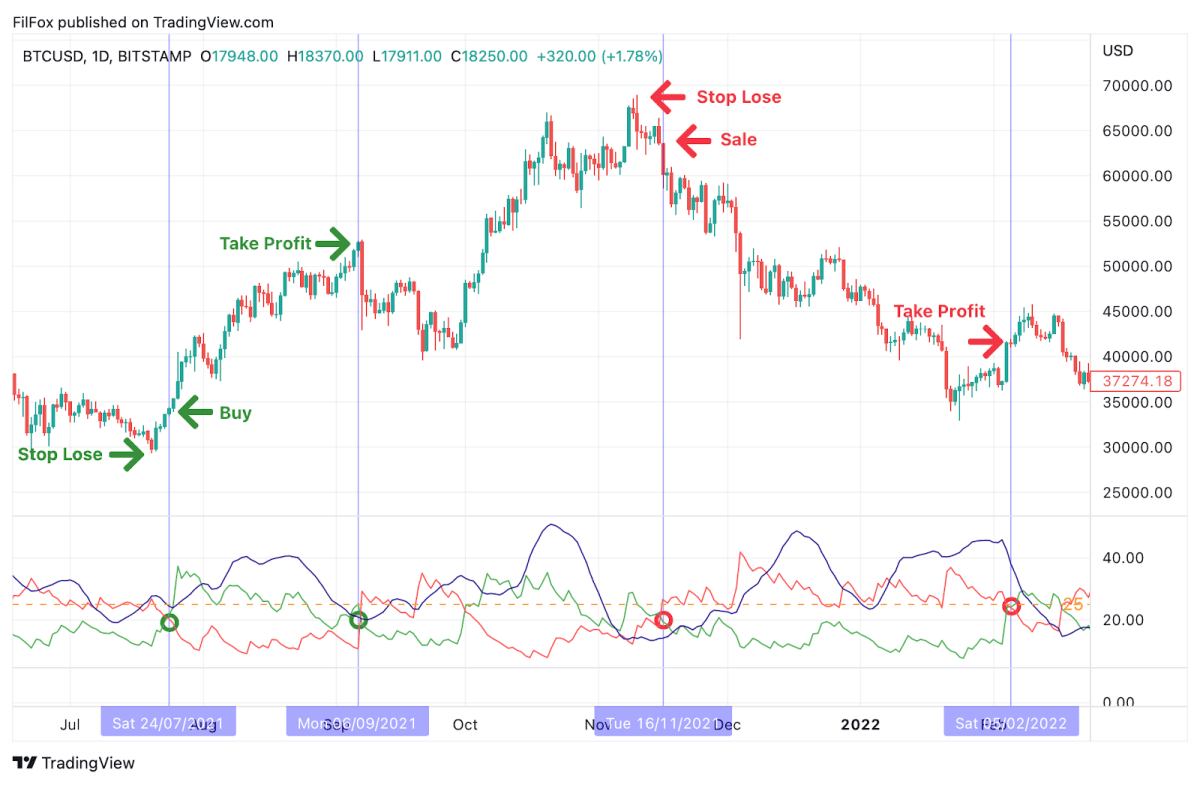
The DI (Direction Index) lines show changes in the growth and decline in the price of an asset.
If the green DI+ line is above the red DI-, then the trend is up.
If the red DI- is above the green DI+, then the trend is down.
Let's examine one of the strategies that uses the ADX indicator along with DI lines and outline its advantages. The points of intersection of the DI+ and DI- lines can be considered entry points, if the trend comes into force at the same time, that is, the blue indicator line rises above 25.
According to the picture, the green DI+ crosses the red DI- from bottom to top – this is the entry point to a long position. Stop Loss is set at the last minimal price, and Take Profit is placed where the green DI+ crosses the red DI- line from top to bottom. At the same time, the blue indicator line should decline, indicating a weakening of the uptrend.
Shorts should be placed when the red DI- crosses the green DI+ from below and the blue indicator line rises, indicating a strengthening of the downtrend. Stop Loss is set at the last maximum price, and Take Profit is set at the intersection point of DI- and DI+.
The advantages of this strategy include the automatic generation of trading signals and risk reduction.
The disadvantages of the strategy are that it is challenging to choose the closing points for an open position. The level of setting Stop Loss is sometimes unclear and wide enough. Another disadvantage is a relatively long period of time when a trading signal is formed.
Summary
At first glance, the ADX indicator seems simple. But after a more thorough study, we can see that most of the signals are formed with a delay, so it is advisable to use them together with other TA tools and make trading decisions based on a joint analysis.

