Bitcoin Bottom Not Reached Yet?

Despite market fluctuations, the mother-of-all-crypto may not have hit its bottom just yet.
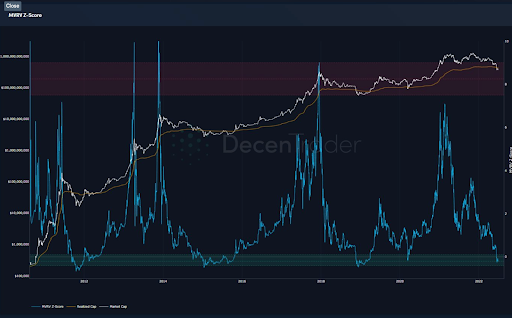
Bitcoin’s MVRV-Z Score – a measurement that shows how high or low the Bitcoin spot price is compared to so-called “fair value” – is not indicating a price reversal. This Score uses a market cap and realized price data alongside standard deviation. It is also deemed highly precise.
According to multiple analysts, including Filbfilb, the co-founder of the trading suite DecenTrader, the MVRV-Z score is in its classic green zone. However, the bottom has not been reached.
This chart is *the one* for me. We normally bottom when MC < realized cap by around 30% - currently $15.6k. This was when macro times were relatively good, anything above here is a risk that it’s different this time IMO.Filbfilb writes.

Bitcoin MVRV-Z Score chart. Source: Filbfilb’s Twitter
Other predictions point to the same values.
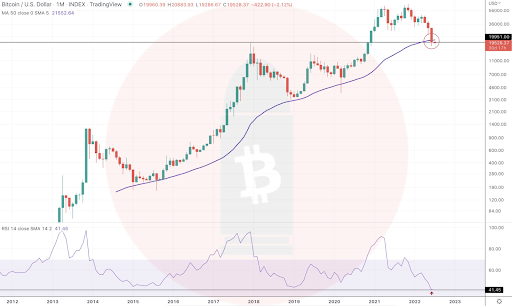
Cryptobullet, a popular Twitter handle that offers insights into the cryptomarket data, tweeted that $16,000 marks the average deviation from Bitcoin’s 50-month moving average.
The tweet reads:
Some very important levels: 16k - Average Deviation from MA50 (-25%) 14k - 2019 Echo Bubble Top 12.2k - Celsius Liquidation 10.7k - Key Horizontal Level.
The account also indicates that the month of June closed below the MA50 for the first time in history, December 2020-April 2021 rally is fully engulfed and the lowest monthly Relative Strength Index – which is intended to chart the current and historical strength or weakness of a stock or market based on the closing prices of a recent trading period – ever.

Bitcoin/U.S. Dollar Chart Source: Cryptobullet’s Twitter
In response to this tweet, some users agreed that Celsius, which is reportedly going through financial turmoil and has put a halt to asset withdrawal, will soon be liquidated.
Celsius is going to be liquidated, then we will see the real crash, but also a nice and rare opportunity.wrote a user who goes by the name Alin Pop.
Recommended

