Bitcoin Hits $35,000. Are the Bulls Back in Control?

On October 24, Bitcoin reached a new yearly high of $35,200, showcasing a remarkable 18% surge within just 24 hours.
In the derivatives market, contracts worth more than $350 million were liquidated, and several altcoins from the top 100 by market cap experienced 10-15% gains. The crypto community is abuzz, questioning the legitimacy of Bitcoin's recent rise and speculating if we're truly on the brink of another bull cycle.
Let's explore the underlying fundamental and technical factors shaping Bitcoin's price to anticipate potential forthcoming trends in its trajectory.
Fundamental Factors Behind the Bitcoin Rise
The primary catalyst behind Bitcoin's ascent is the potential SEC approval of spot Bitcoin ETFs. Despite recent fake news from Cointelegraph, investors remain bullish on the prospects of Bitcoin ETFs getting the nod.
Their optimism isn't unwarranted: the U.S. regulator can't keep postponing this decision indefinitely. Considering the latest developments — Ripple and Grayscale's legal victories against the SEC, rumors about Ripple's impending IPO, and ETF contenders tweaking their applications to meet SEC criteria — the approval of Bitcoin ETFs seems inevitable.
Another essential factor is the current U.S. economic backdrop. In this scenario, Bitcoin's trajectory is influenced by indicators such as the Consumer Price Index, which signals inflation trends, and the Federal Reserve's stance on interest rates. The former, although no longer declining, remains at levels observed in mid-2021. Simultaneously, projections indicate a potential halt in rate hikes for the foreseeable future.
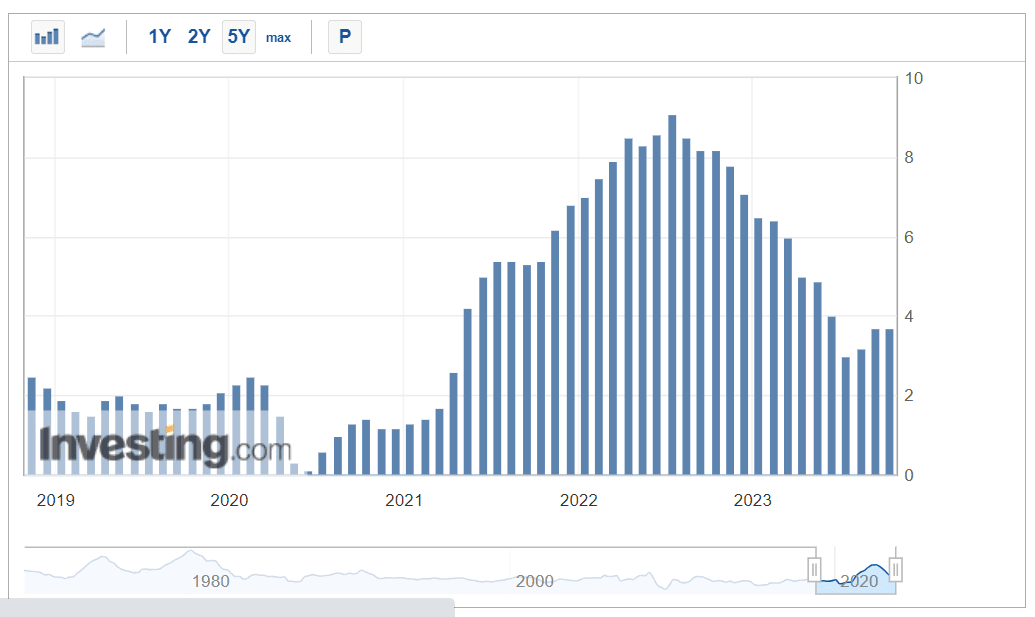
Data on the Consumer Price Index. Source: investing.com
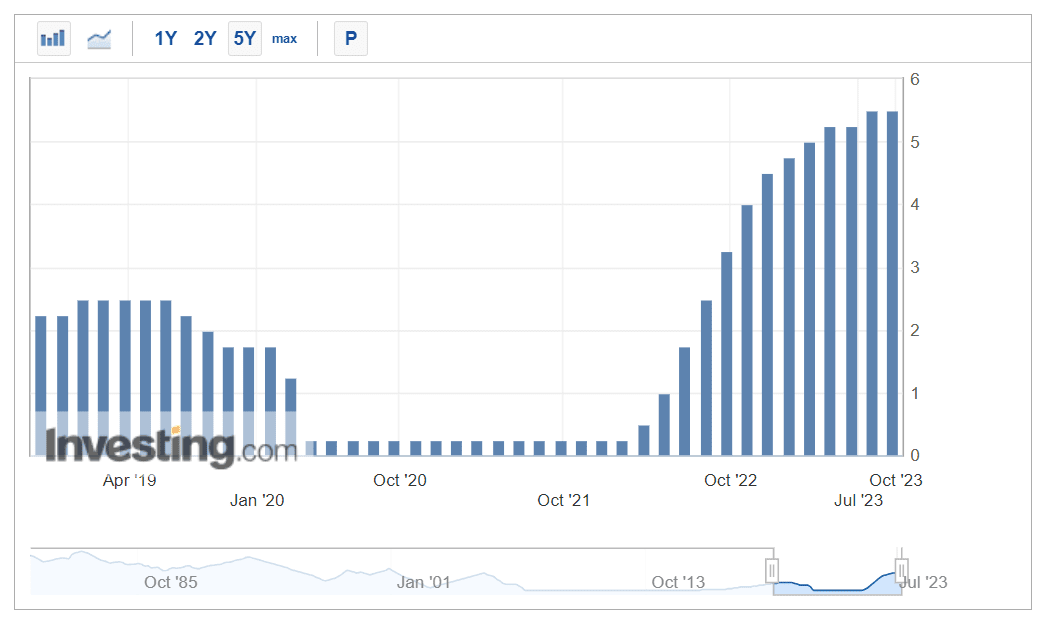
Data on U.S. Interest Rates. Source: investing.com
Thus, the stock market, gold, and Bitcoin are on an upward trajectory, not so much due to distinct positive market news, but rather the lack of negative headwinds.
Technical Factors Behind the Bitcoin Rise
The ongoing downward trend that began towards the end of 2021 remains significant. Nevertheless, recent developments suggest a noticeable shift towards an upward momentum. Since the beginning of the year, BTC has seen a substantial 110% increase. This growth pattern appears to be steady, featuring occasional corrections that align with its primary trajectory. Just as small streams combine to create larger rivers, broader trends emerge from foundational movements.
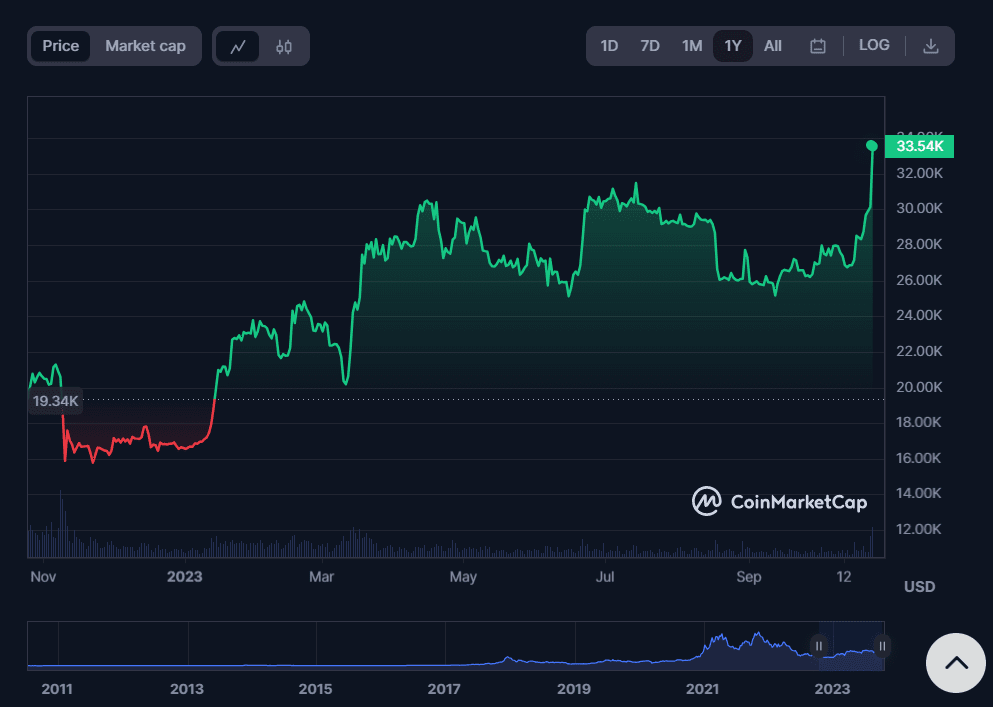
BTC's Growth in 2023. Source: coinmarketcap.com
Importantly, substantial trading volumes accompanied each growth phase. This signifies that the upward trend is genuine. This surge is not merely a result of sellers pushing up their prices, but rather a reflection of strong demand and a clear enthusiasm among investors to acquire BTC. At the time of writing this article, the average daily trading volume for this leading cryptocurrency on exchanges surpasses $55 billion.
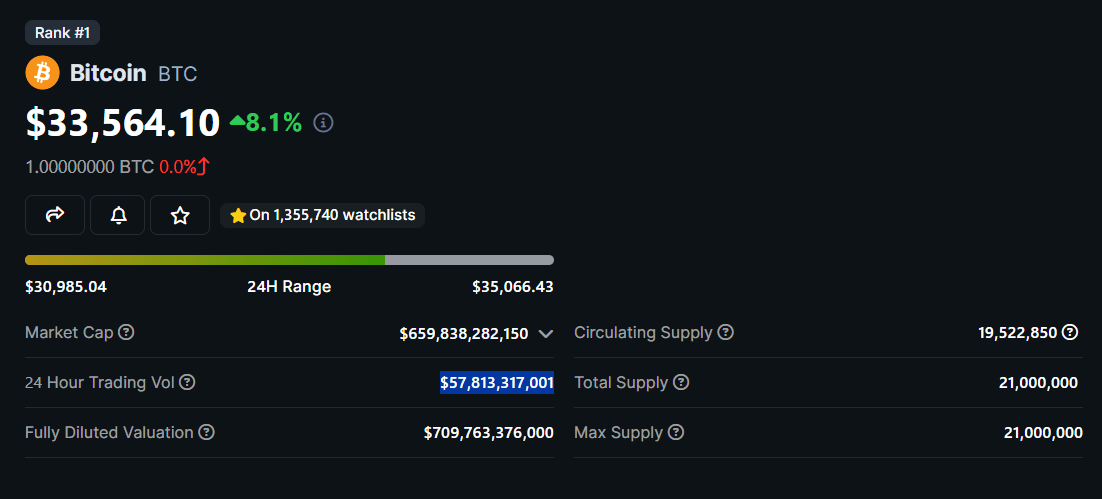
BTC's Trade Volume. Source: coingecko.com
The current pressing issue is how the market will respond to BTC approaching its next high. Earlier this year, the $32,000 threshold was tested unsuccessfully on two occasions. Should buyers maintain their liquidity, Bitcoin has the potential to sustain its growth, possibly boosting the value of other cryptocurrencies in its wake.
BTC Dominance Hits a High
The BTC dominance index is currently at 54%, reaching a two-year high. This significant metric suggests that altcoins are lagging behind the growth of the main cryptocurrency.
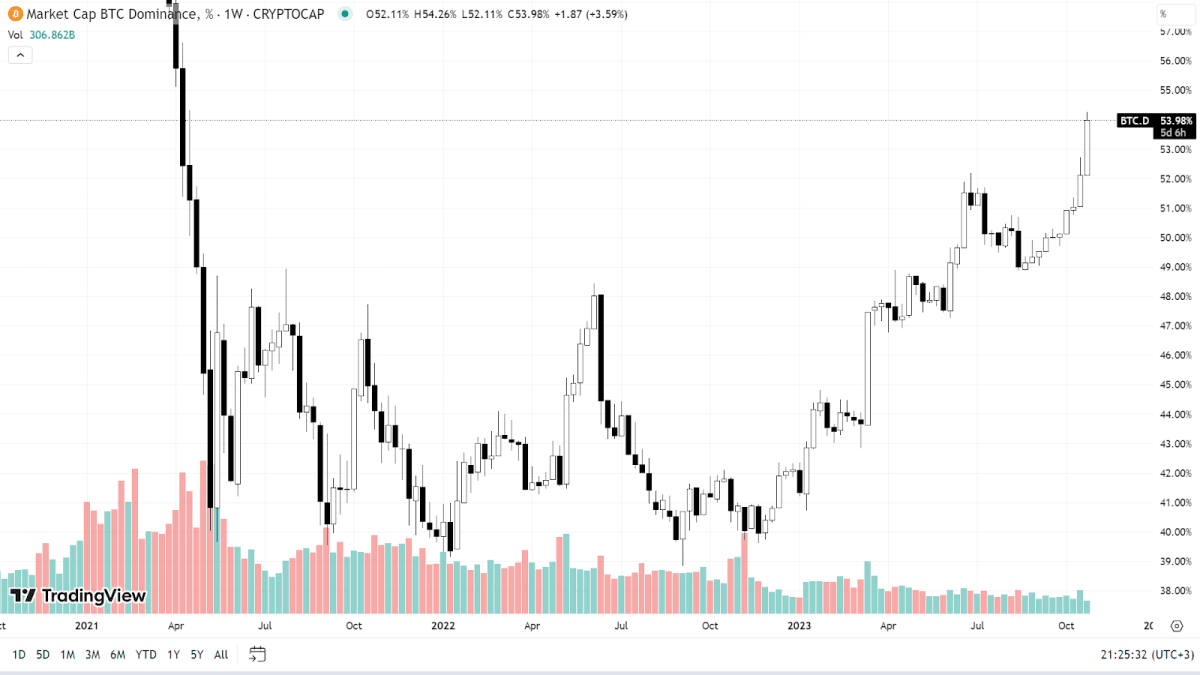
BTC Dominance Index. Source: tradingview.com
A distinctive feature of a bullish market is the onset of an "altseason." This is typically marked by a rapid decline in BTC's dominance and an increase in the market capitalization of other digital assets. This shift might occur if Bitcoin stabilizes and moves sideways over an extended period, such as 3-6 weeks. Such a trend would allow traders the flexibility to shift liquidity towards altcoins.
However, there's a flip side to this approach. If BTC experiences a sudden downturn, other tokens often suffer more severe drops. This dynamic can trigger hyperinflationary conditions in the altcoin market. Hence, investors must be cautious when considering investments in altcoins, even if they seem to have substantial growth potential.
Mining Difficulty
Interestingly, even as Bitcoin's price has shown fluctuations, its mining difficulty has steadily increased. At present, the Bitcoin network's hashrate stands at a record 452 EH/s. The most recent adjustment has raised BTC's mining difficulty by 6%, and given the current market trends, this rise may persist.
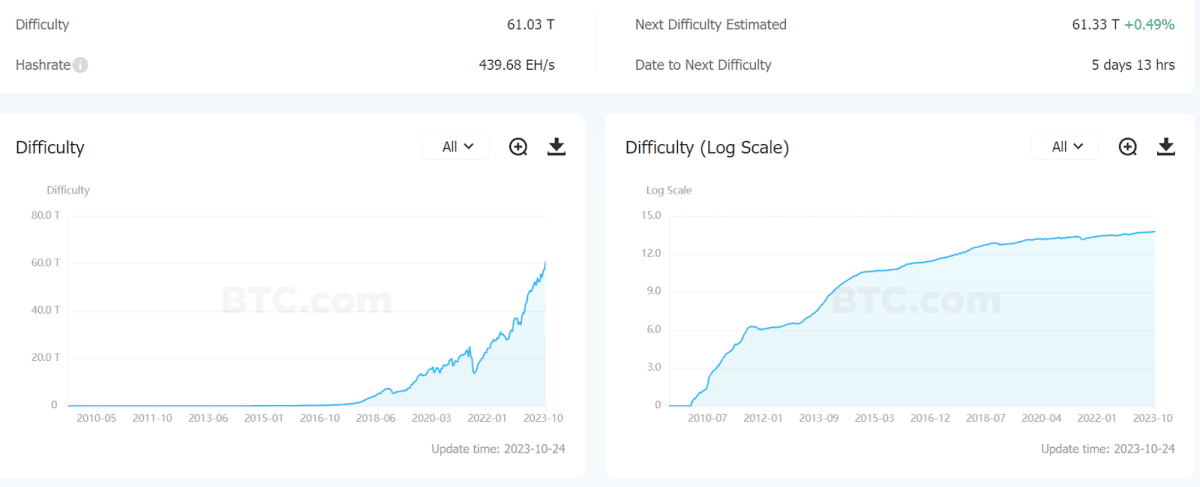
BTC Mining Difficulty. Source: btc.com
This upward trend indicates that miners are consistently upgrading their computational capabilities and bringing in more sophisticated equipment for mining. A closer look at BTC's performance reveals that miners are accumulating, possibly intending to sell at higher prices in the future. In essence, miners are showcasing their confidence in Bitcoin's potential future gains, backing up their belief with tangible investments.
Bitcoin Volatility Index
On October 24, the Bitcoin volatility index hit 7.11, a significant peak not seen in the last one and a half years, aligning with the figure from August 17. Based on this indicator's readings, Bitcoin's price movement is expected to enter a quieter phase in the coming days.
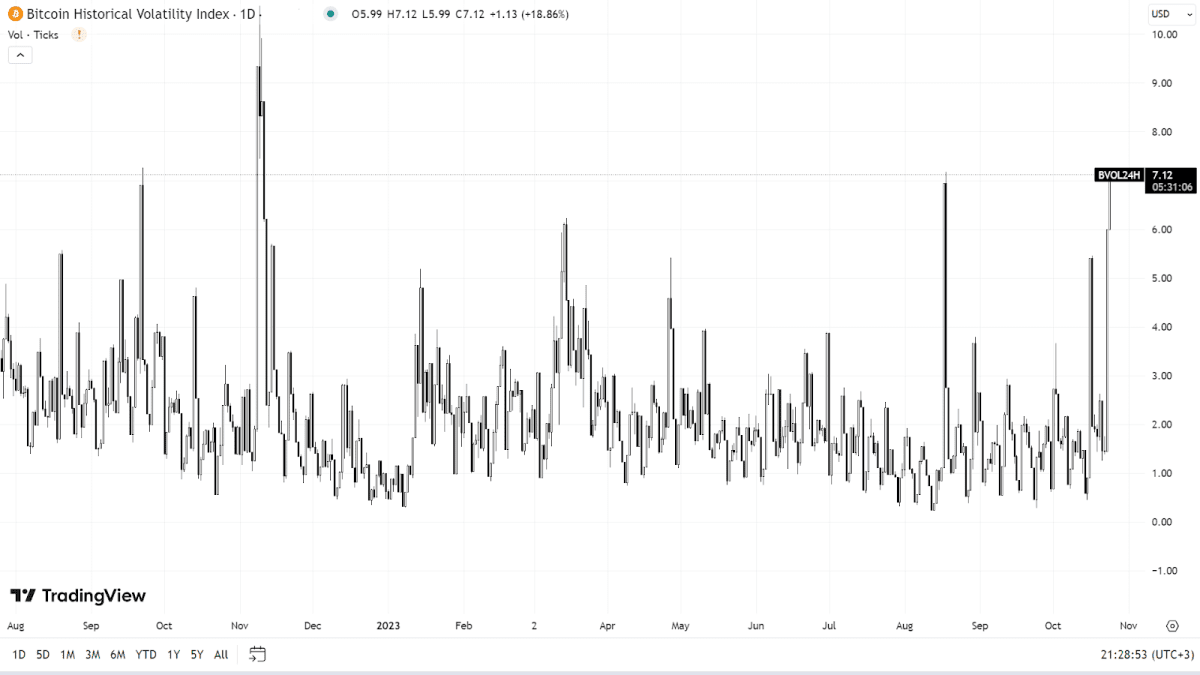
Bitcoin Volatility Index. Source: tradingview.com
This potential price stabilization for Bitcoin can promote the broader cryptocurrency market's continued growth. As previously highlighted, when Bitcoin trends sideways, it often spurs heightened interest in altcoins, thereby reducing Bitcoin's market dominance. This scenario could allow other cryptocurrencies to approach or even surpass their respective all-time highs.
Fear and Greed Index
Analytical platform Coinglass reports that the current index is pointing towards an elevated level of greed among investors, marked at 66 points. A look back at the historical trends of this index reveals that during prior bullish phases in the cryptocurrency market, the greed level surged to figures between 75 and 90 points.
Observing the index's behavior over the past year and a half, it touched its lowest at 6 points on June 9, 2022. Since then, there's been a steady rise, displaying significant momentum. Presently, the Fear and Greed Index hasn't surpassed its annual high, suggesting the leading cryptocurrency might still have room to grow.
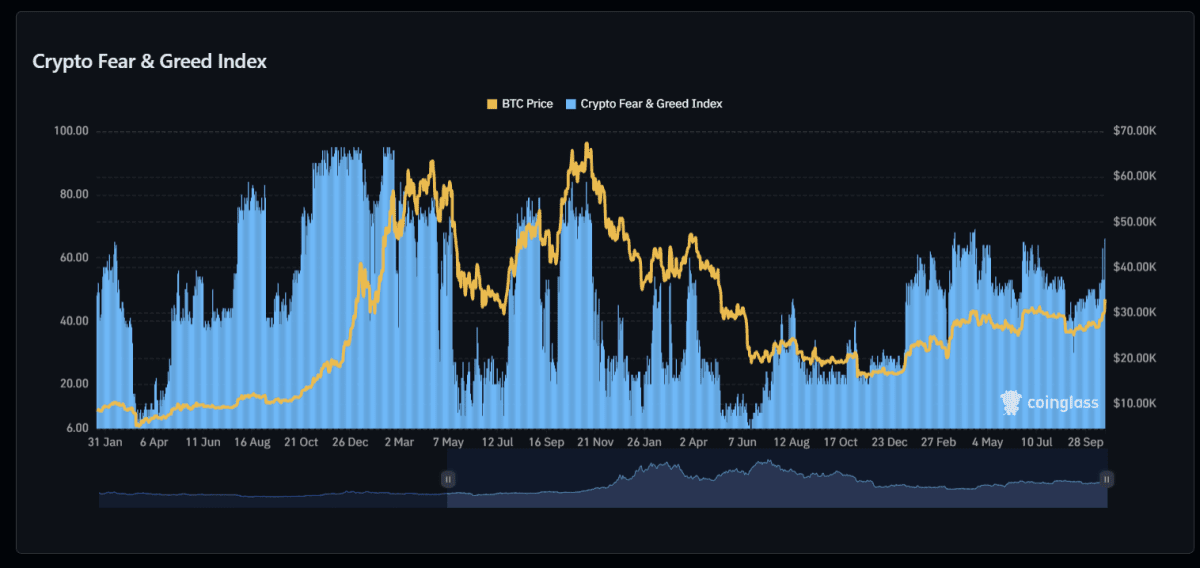
The correlation between the Fear and Greed Index and Bitcoin's price. Source: coinglass.com
Bitcoin Holdings on Exchanges
A pivotal indicator in the cryptocurrency landscape is the volume of bitcoins stored on centralized exchanges. As it stands, the CEXs are home to approximately 1.82 million BTC.
What's noteworthy is that on October 14th, just before Bitcoin's climb to $35,000, users collectively pulled 250,000 BTC off these platforms. This exodus signifies a robust interest in cryptocurrencies from both institutional and individual investors. It even hints at the possibility that some BTC purchasers might have had prior knowledge of the impending price surge.
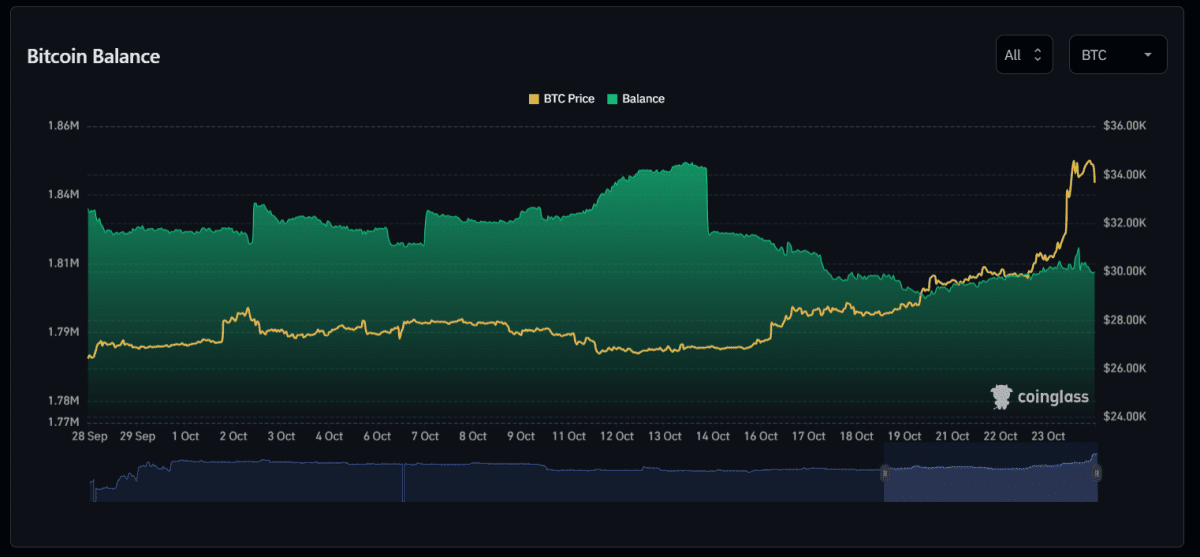
BTC balance on centralized exchanges. Source: coinglass.com
A parallel trend is observed in the metrics related to BTC transfers. A pronounced surge in activity was registered precisely on October 14.
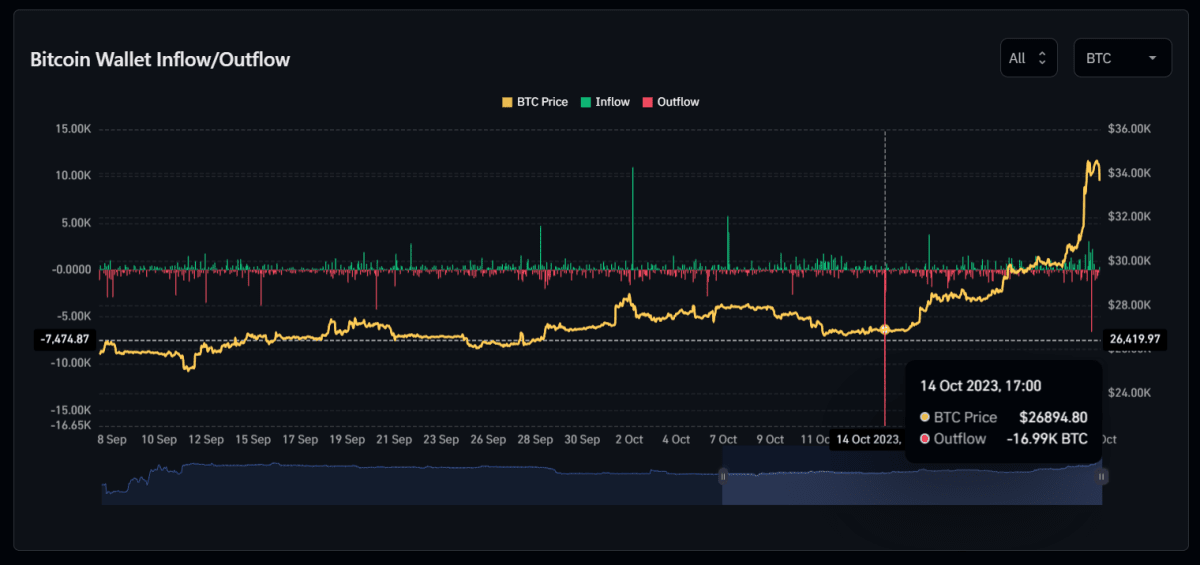
BTC transfer dynamics from exchanges to personal wallets. Source: coinglass.com
These observations imply that there's no sudden influx of coins on the exchanges, suggesting that the market isn't inclined to part with their assets at the prevailing rates. This naturally alleviates any downward selling pressure.
Past Bullish Trends: A Retrospective
From July to December 2017, Bitcoin witnessed an impressive 800% growth. Fast-forward to December 2020 to April 2021, and we saw a 400% surge. Lastly, between July and November 2021, there was a 100% increase.
Intriguingly, each bullish phase lasted roughly six months. In contrast, the current growth has persisted for 10 months. This duration could suggest that Bitcoin is approaching its cycle's peak, pointing to a potential overbuying scenario in the market. However, since Bitcoin’s behavior tends to shift with each cycle, relying solely on past patterns might not provide a complete picture.
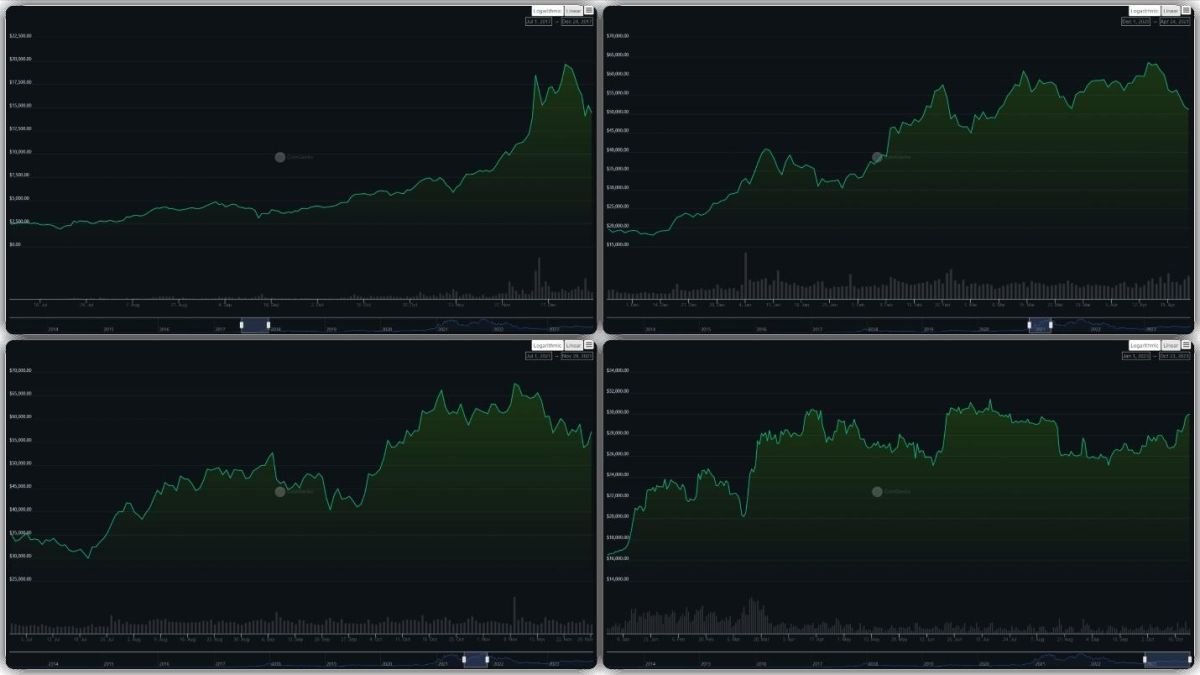
Bitcoin's Ascending Trends Over Various Periods. Source: coingecko.com
Final Words
Analyzing the aforementioned data, it appears that BTC's current growth trajectory is substantial and that there's still potential for buyers to continue the upward push. However, as of October 24, BTC is not far from its annual high, which might not present the most favorable buying opportunity. For those considering immediate purchases, it would be wise to await a market adjustment and to closely track the array of indicators and factors highlighted in this piece.
Recommended

