Bitcoin Surges to New Heights: BTC and PAXG Analysis for 22/06/23

On June 21, Bitcoin soared to a local high at $30,700. Despite an expected correlation, the ascent of Pax Gold fails to keep pace with BTC. The current market landscape for Bitcoin and gold-backed stablecoin Pax Gold as of 22/06/23.
Bitcoin
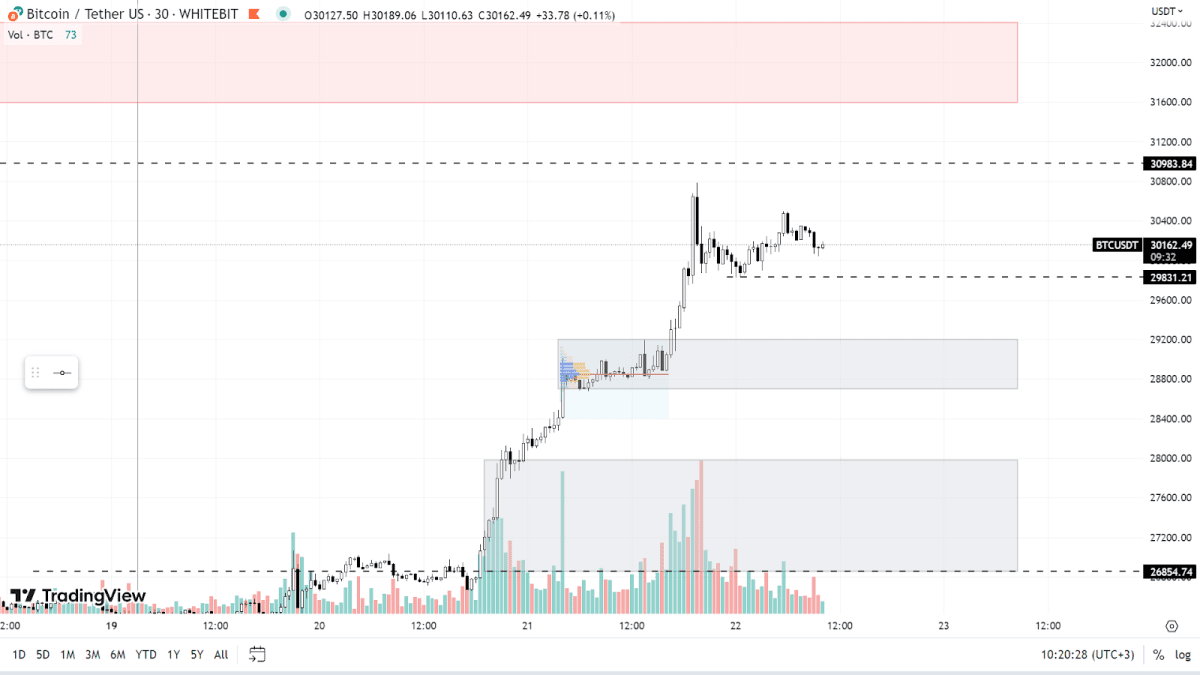
Yesterday, the leading cryptocurrency surged to a new local peak, reaching $30,700. The resistance level at $31,000 remains a key factor, with potential sell orders expected to be concentrated within the $31,600-$32,400 range.
Buyers continue to exert significant pressure on the price, resulting in a substantial amount of unfulfilled liquidity. Presently, the crucial support levels are identified at $29,800, along with the zones ranging from $28,700 to $29,200 and $26,800 to $28,000. The previously analyzed ranges maintain their relevance per yesterday's analysis.

BTC chart on the M30 timeframe
Pax Gold (PAXG)
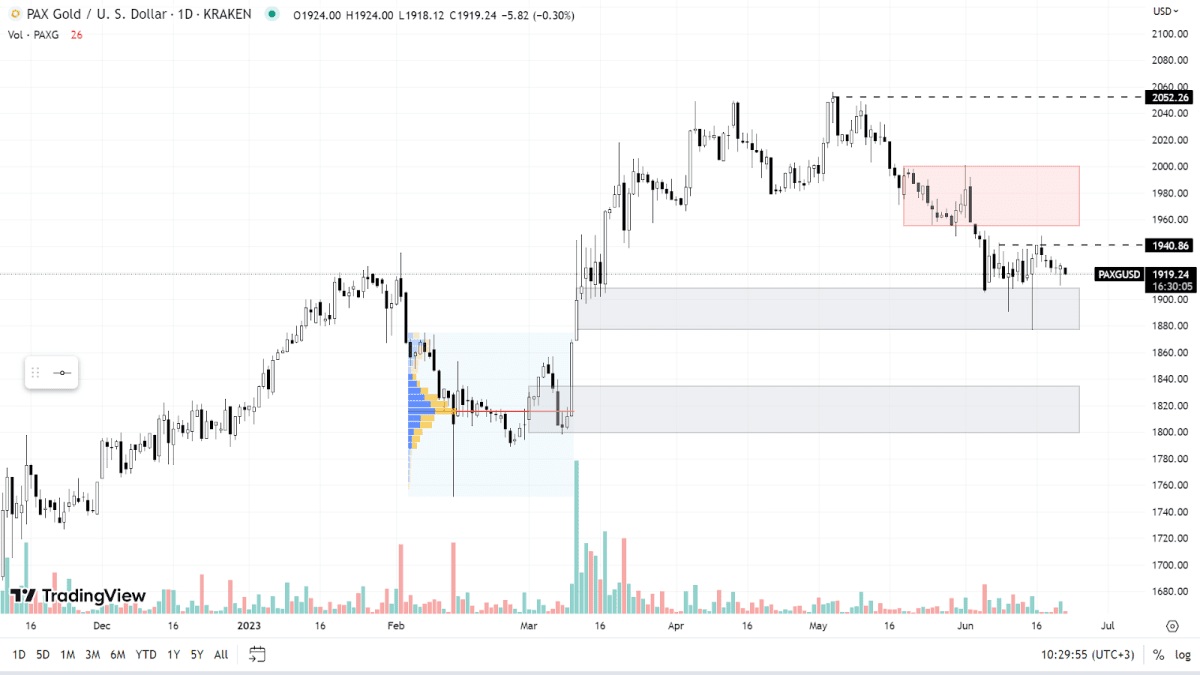
Despite the expected correlation with the stock market, the current gold chart shows little resemblance to the BTC price movement. This divergence is notable considering the historical symmetry observed between BTC and gold in 2023. The lack of correlation suggests either a shift in the involvement of institutional investors or the influence of retail investors driving crypto prices.
Currently, PAXG exhibits remarkably low volatility, trading within the support zone of $1,877-$1,908. The next significant buying level is expected in the range of $1,800-$1,834. The immediate resistance level to watch is $1,940. If selling pressure increases, a potential sell-off may occur within the range of $1,955-$2,000, with a further level at $2,052.

PAXG chart on the Daily timeframe
BTC dominance has recently reached a new peak above 51.7%. However, there is a likelihood of a forthcoming decline as liquidity flows from BTC into altcoins.
Check out GNcrypto for the latest cryptocurrency rates and chart analysis.
Disclaimer
Please note that the analysis provided above should not be considered a trading recommendation. These are solely the opinions of the GNcrypto editorial board regarding the market situation. Before opening any deals, we strongly advise conducting your own research and analysis.
Abbreviations
TF (Timeframe) — a chronological period equal to the time it takes to form one Japanese candle on the chart.
Horizontal channel (flat, sideways, range) — the movement of price between support and resistance levels, without going beyond the given range.
К — simplified designation of one thousand dollars of the asset price (for example, 23.4K - $23,400).
Gray range on the chart — a support zone.
Red range on the chart — a resistance zone.
Correlation — the tendency of prices of different cryptocurrencies to move in sync, often influenced by the dominance of one of the assets.
Initial materials
This analysis was informed by the following educational materials and articles from GNcrypto:
Recommended

