BTC and MATIC Price Analysis for October 24, 2023

Bitcoin surged by 14% last night, reaching an annual high of $35,280. Here's an in-depth review of Bitcoin (BTC) and Polygon (MATIC) as of Tuesday, October 24.
Bitcoin (BTC)
Investors showcased a pronounced buying interest, propelling BTC to a meteoric rise, and overcoming various resistance points. Within just a few hours, Bitcoin accomplished what it hadn't since the start of the year — it breached the $32,000 mark and confidently stayed above it.
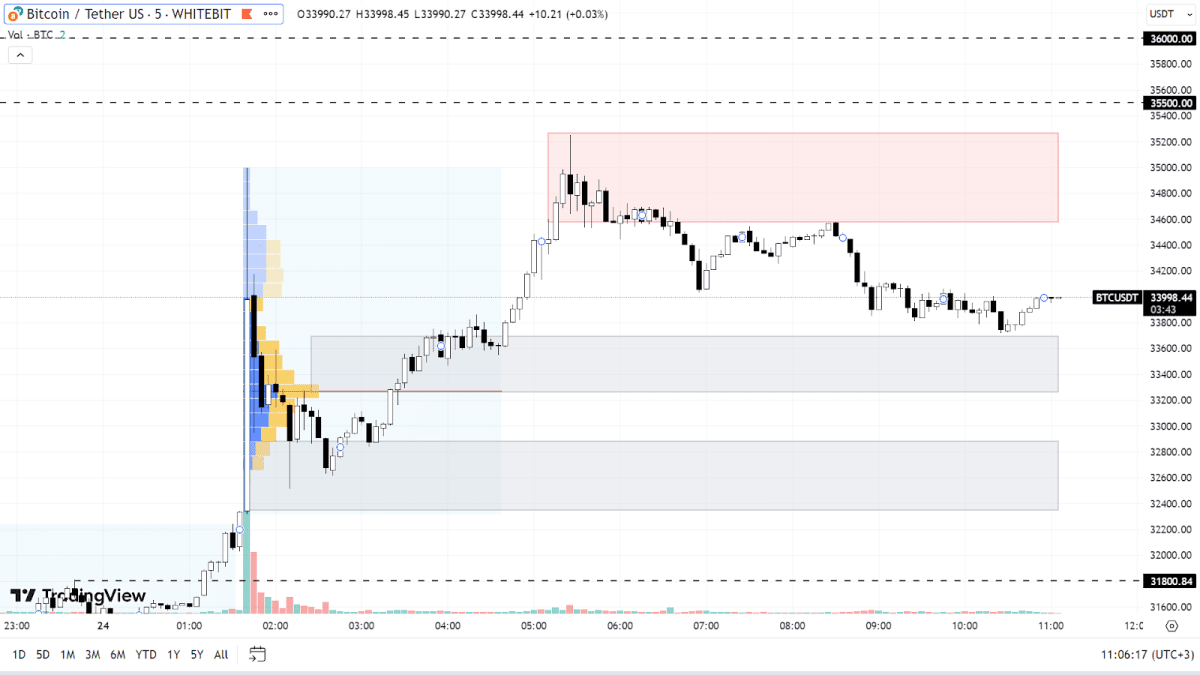
As of now, Bitcoin's upward trajectory remains solid. The primary resistance zone is pinpointed between $34,500 and $35,200. Next in line are the levels at $35,500 and $36,000, which are likely targets for the ongoing bullish phase. It's plausible these markers will be approached in the upcoming days.
For now, the chances of BTC undergoing a correction appear slim. If a dip occurs, the asset's price could retract to the support zones at $33,200-$33,700 and $32,300-$32,800. A more substantial dip would engage the $31,800 buyers' zone, marking the potential bottom of a short-term decline.

BTC chart on the М5 timeframe
Polygon (MATIC)
The altcoin market is mirroring BTC's performance quite closely. Most assets, MATIC included, are on an aggressive upward trajectory, following Bitcoin's lead. However, altcoins seem to have more room to grow, given that only a handful have touched their yearly highs.
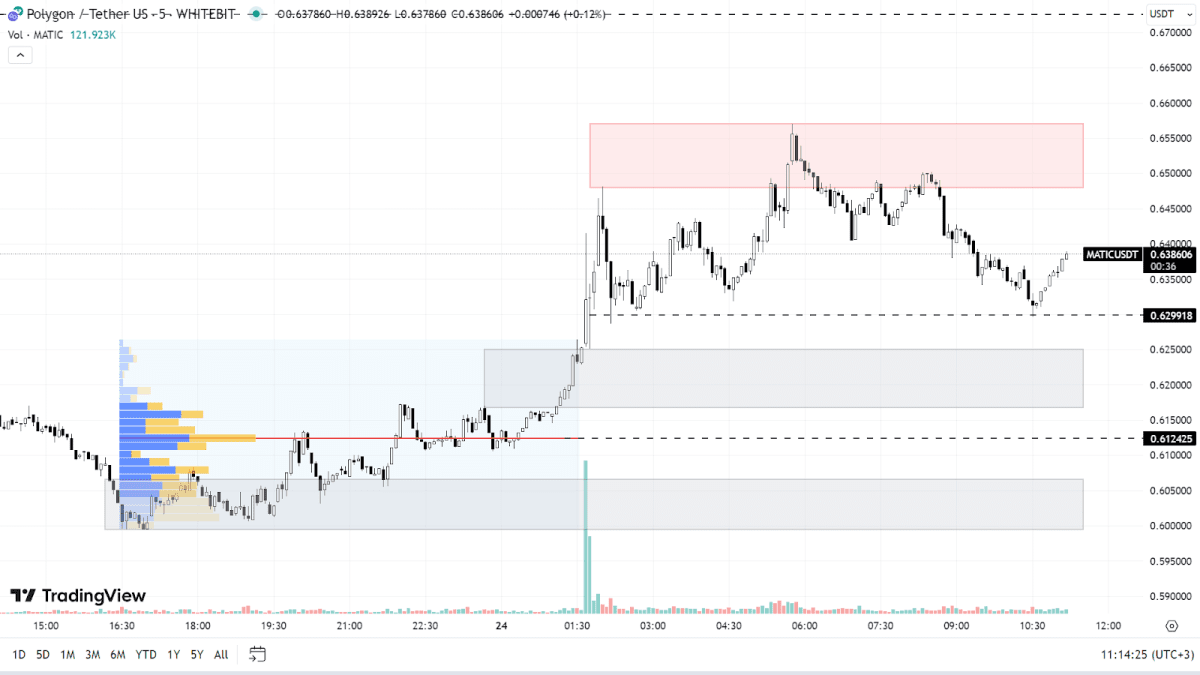
Presently, the MATIC trajectory is bullish. Its price is wedged between a support level at $0.63 and a resistance zone spanning from $0.648 to $0.657. Assuming this momentum continues, investors should keep an eye on the $0.67 and $0.70 milestones.
Although the MATIC movement is somewhat more subdued compared to BTC, short-term corrections are expected. Buying orders are mainly clustered around the $0.616-$0.625 zone, with significant levels at $0.612 and the range of $0.600-$0.606.

MATIC chart on the М5 timeframe
During such market fluctuations, prudence is paramount. Jumping into BTC at its current peak of around $34,000 might not be the best strategy, even if there's potential for further growth. It might be more prudent to await market stabilization before making spot trading decisions.
Check out GNcrypto for the latest cryptocurrency rates and chart analysis.
Disclaimer
Please note that the analysis provided above should not be considered a trading recommendation. Before opening any deals, we strongly advise conducting your own research and analysis.
Abbreviations
TF (Timeframe) — a chronological period equal to the time it takes to form one Japanese candle on the chart.
Horizontal channel (flat, sideways, range) — the price movement between support and resistance levels, without going beyond the given range.
К — simplified designation of one thousand dollars of the asset price (for example, 23.4K – $23,400).
Gray range on the chart — a support zone.
Red range on the chart — a resistance zone.
Correlation — the tendency of prices of different cryptocurrencies to move in sync, often influenced by the dominance of one of the assets.
Initial materials
This analysis was informed by the following educational materials and articles from GNcrypto:
Recommended

