BTC and SOL Price Analysis for October 3, 2023

BTC couldn't maintain its position above $28,000, dropping to $27,300. Here's an in-depth look at the market conditions for Bitcoin (BTC) and Solana (SOL) as of Tuesday, October 3.
Bitcoin (BTC)
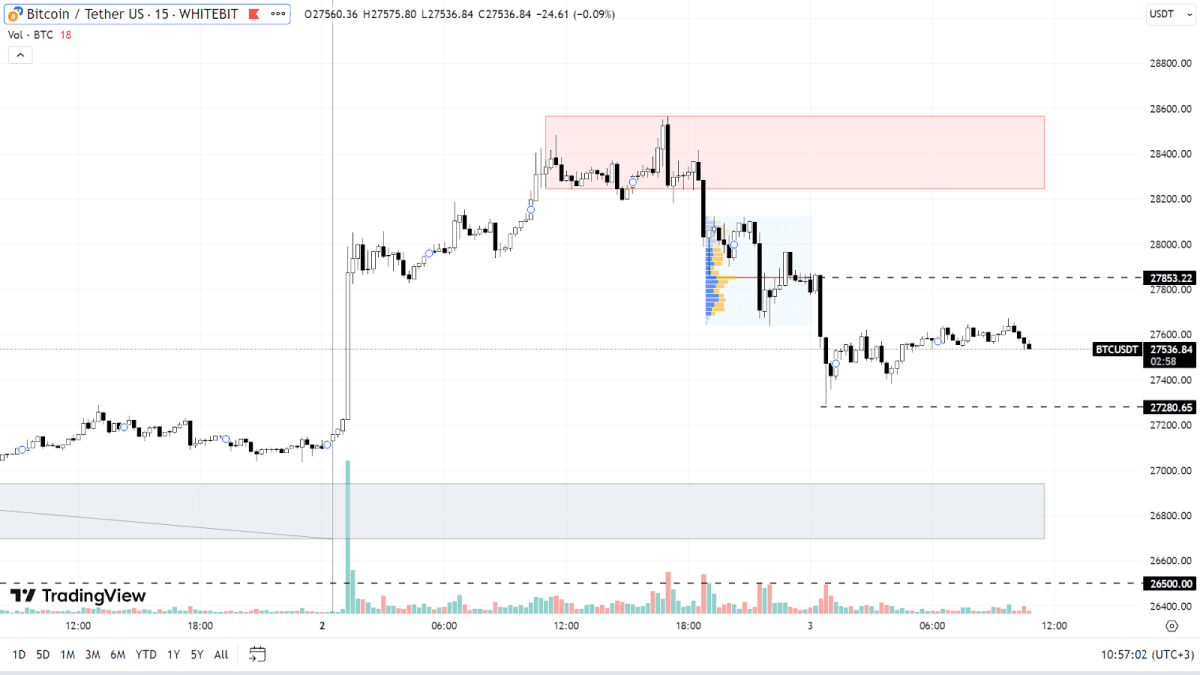
Sellers showed strength in the resistance zone between $28,250 and $28,550, causing the BTC price to retreat to the $27,280 support level. Currently, it seems the correction might continue.
The next prominent buy zone is pegged between $26,700 and $26,900. If the buyers cannot sustain this level, Bitcoin might dip to around $26,500, possibly reaching a new short-term low.
The key resistance stands at $27,850. If Bitcoin can surpass this, it might challenge the $28,250-$28,550 zone again, aiming for the seller-dense area between $29,100 and $29,500.

BTC chart on the М15 timeframe
Solana (SOL)
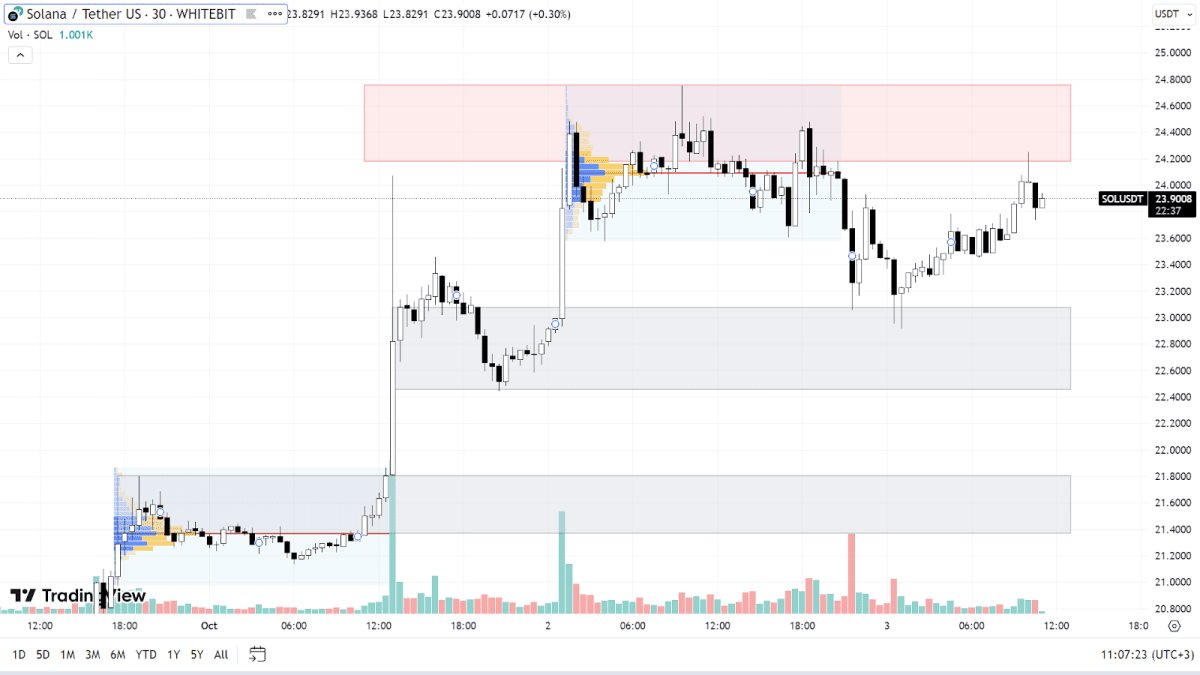
Solana has been showcasing positive momentum, maintaining an upward trajectory for the past three weeks. While the asset's attempt to break the $24.20-$24.75 resistance didn't succeed, the quick rebound following its recent dip indicates that the upward momentum remains strong.
If SOL manages to break through its present resistance, it might aim for $25.5 and could set new highs.
A temporary correction is also possible, with potential declines testing the support zones at $22.5-$23.1 and $21.3-$21.8. Settling beneath the latter range might signal a shift to a downward trend.

SOL chart on the М30 timeframe
Check out GNcrypto for the latest cryptocurrency rates and chart analysis.
Disclaimer
Please note that the analysis provided above should not be considered a trading recommendation. These are solely the opinions of the GNcrypto editorial board regarding the market situation. Before opening any deals, we strongly advise conducting your own research and analysis.
Abbreviations
TF (Timeframe) — a chronological period equal to the time it takes to form one Japanese candle on the chart.
Horizontal channel (flat, sideways, range) — the movement of price between support and resistance levels, without going beyond the given range.
К — simplified designation of one thousand dollars of the asset price (for example, 23.4K – $23,400).
Gray range on the chart — a support zone.
Red range on the chart — a resistance zone.
Correlation — the tendency of prices of different cryptocurrencies to move in sync, often influenced by the dominance of one of the assets.
Initial materials
This analysis was informed by the following educational materials and articles from GNcrypto:
Recommended

