BTC, ETH, and Altcoins: A Market Analysis for February 26, 2024

In today's market roundup, we delve into the chart analyses of Bitcoin (BTC) and various altcoins, including Solana (SOL), Avalanche (AVAX), Tron (TRX), and Polygon (MATIC). Moreover, there is also an overview of the current state of the cryptocurrency market included!
Bitcoin (BTC)
While BTC maintains an overall upward trend, the past week saw it resting in a sideways movement between the support zone of $50,500–$50,900 and the resistance zone of $52,400–$53,050.
Bitcoin buyers took a breather, allowing liquidity to shift towards altcoins. Therefore, a continued sideways trend for Bitcoin seems likely. To set a new yearly high of $53,500, BTC needs to establish support above $52,100, signaling a robust bullish cue.
A deeper correction seems unlikely at the moment. Below the mentioned support, the next cluster of buyer orders lies in the range of $49,300–$49,800, where a response can be expected in case of a price drop. A change to a downward local trend will occur if BTC settles below $49,000.
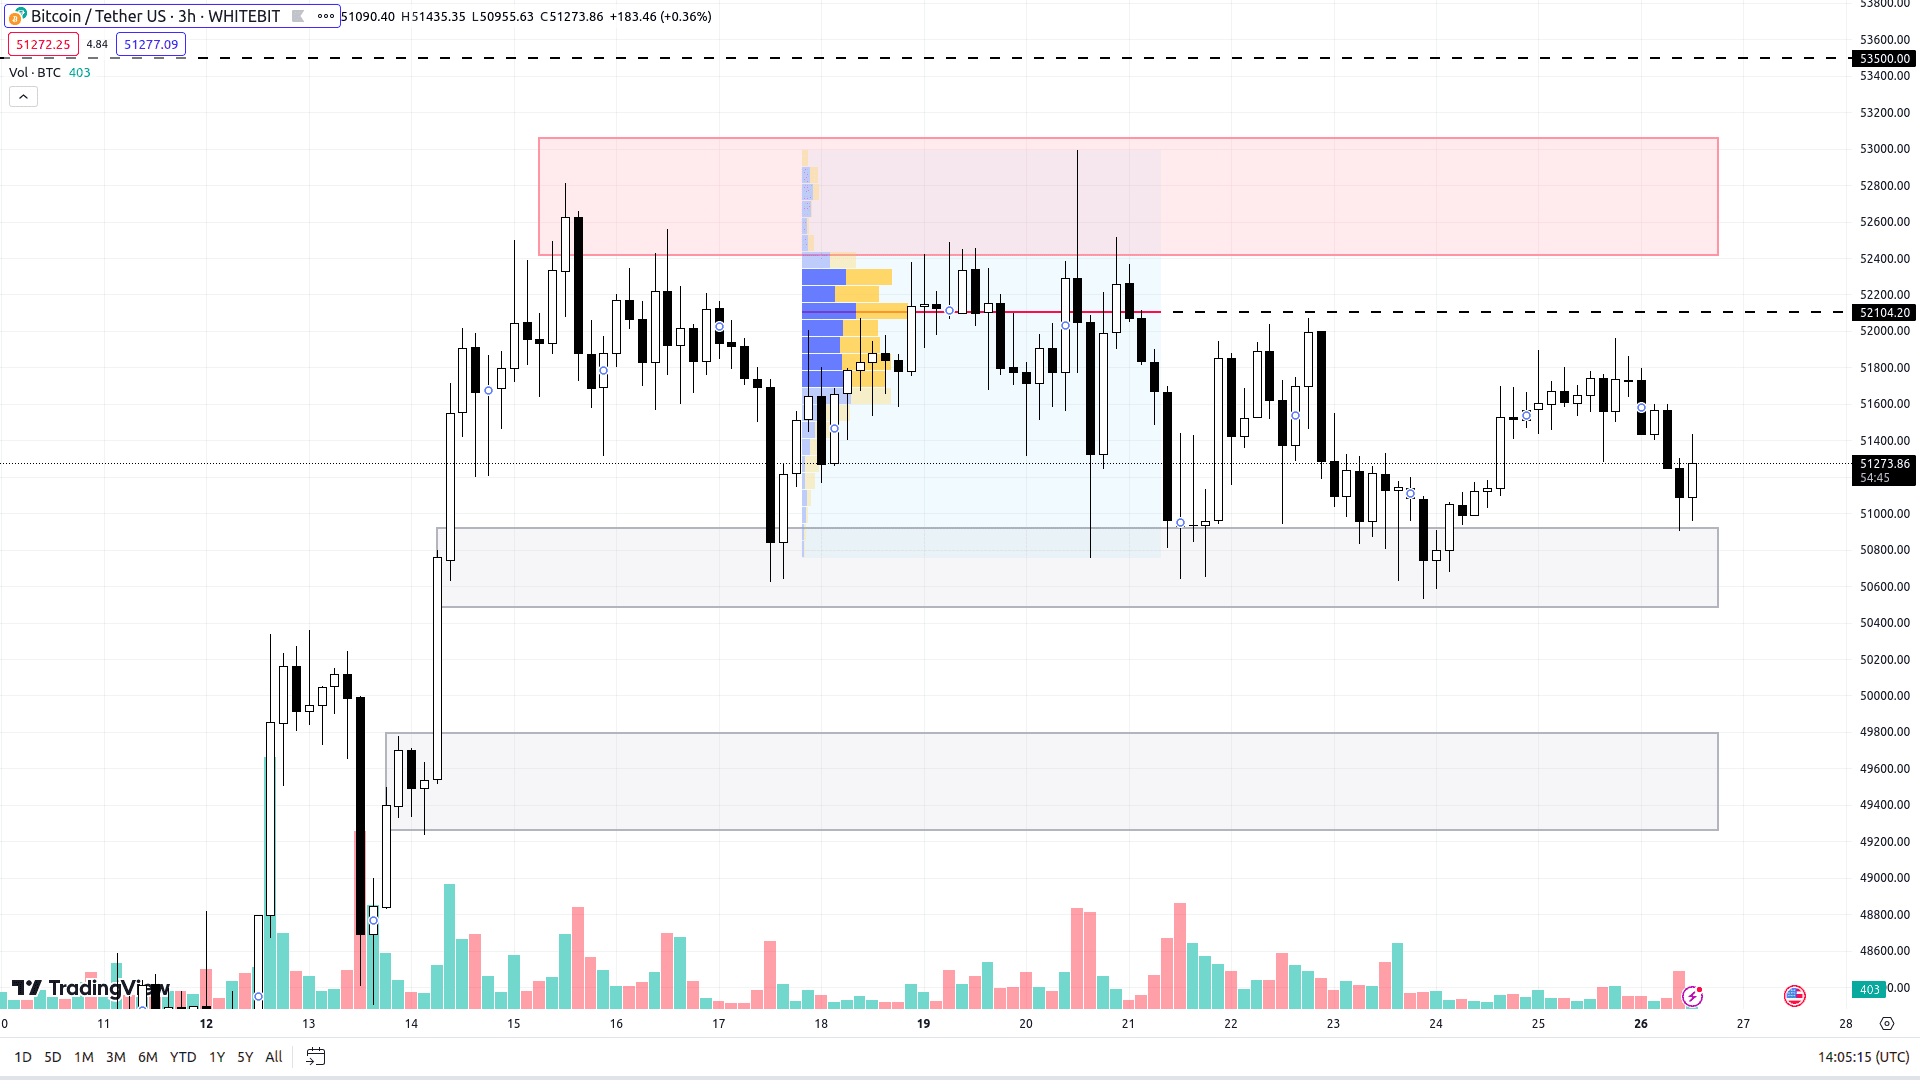
BTC Chart on H3 Timeframe
Ethereum (ETH)
Ethereum has recently outperformed Bitcoin, reaching a new yearly high of $3,135. This surge is attributed to the anticipation of the Dencun update in March 2024 and the major Ethereum Denver conference.
Ethereum’s most probable course is further growth, aiming for the $3,200 mark in the near term.
A potential correction for ETH could be tied to Bitcoin's movement, with key support at $3,030 and additional buyer interest around the $2,870–$2,920 and $2,720–$2,790 ranges.
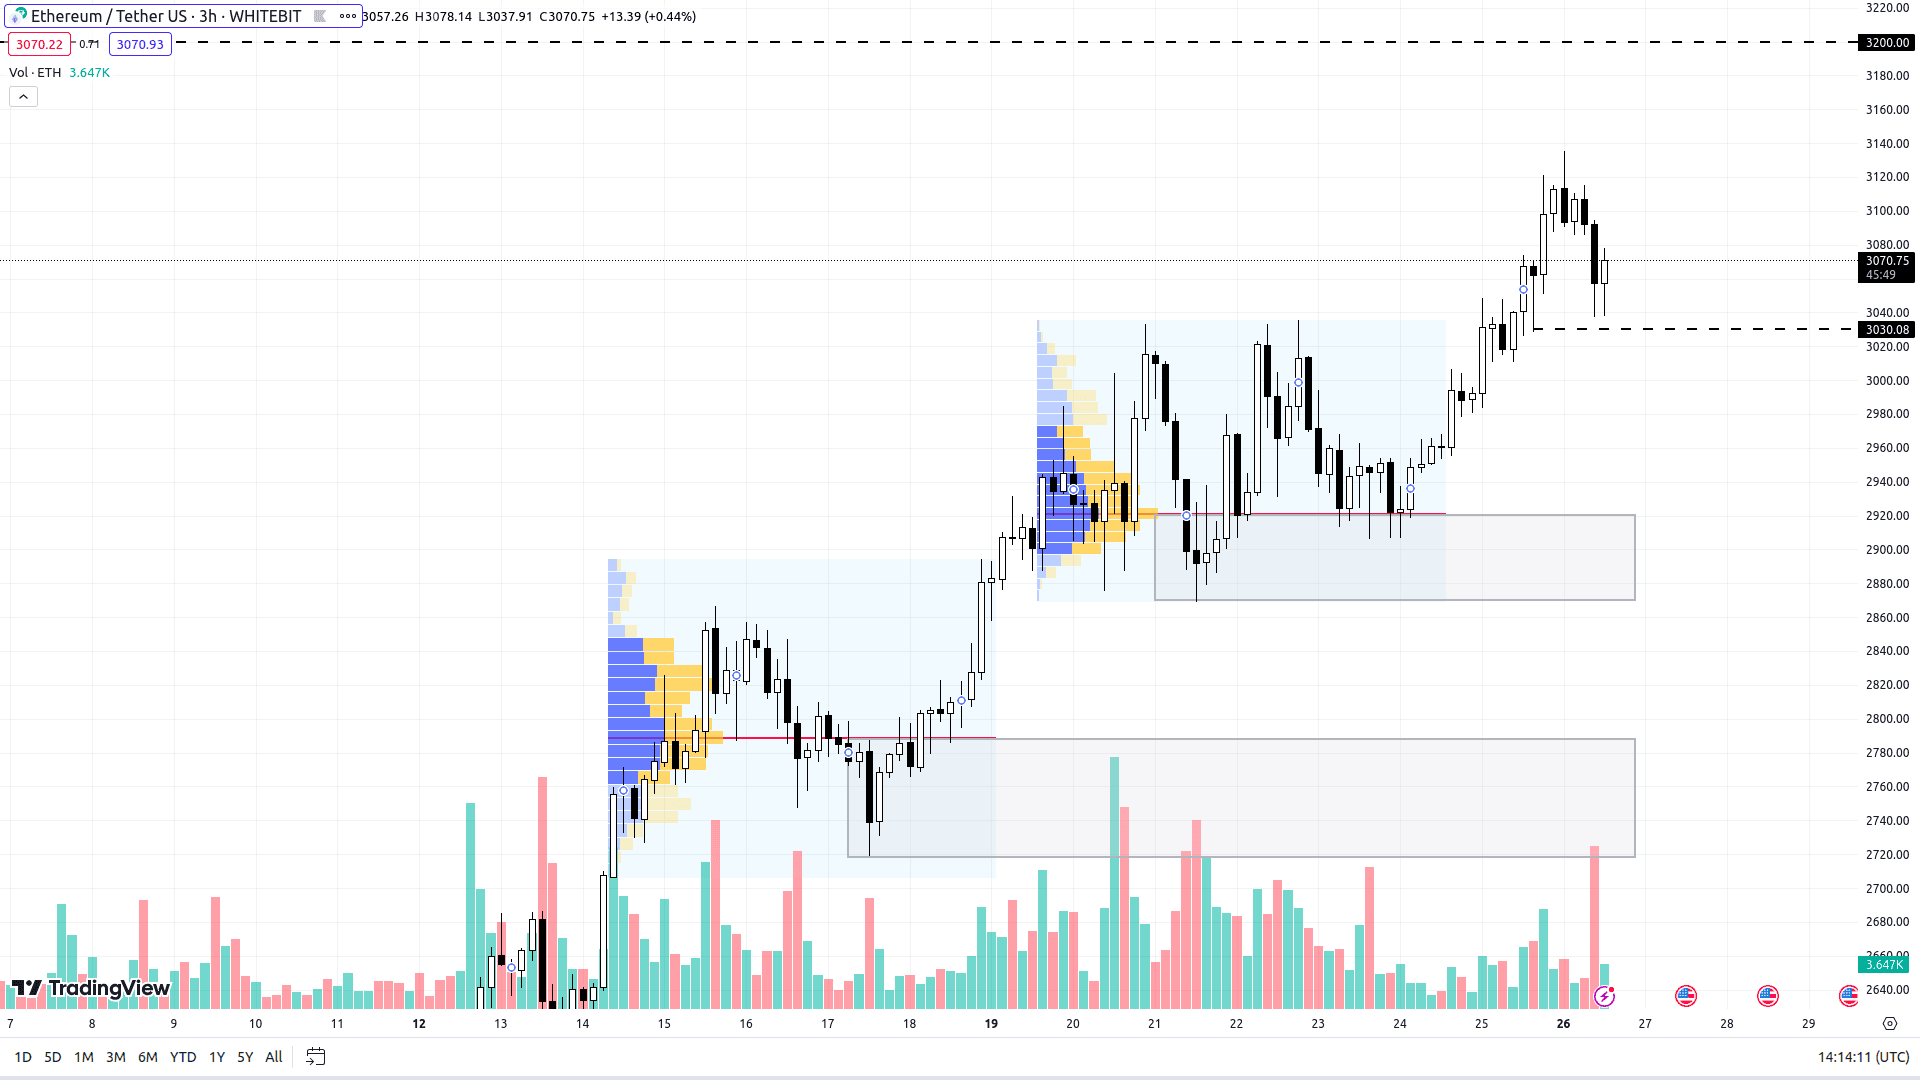
ETH Chart on H3 Timeframe
Solana (SOL)
Last week saw Solana's price declining by 15% after it reached a local peak above $118.
The market is currently in a state of balance, with neither sellers nor buyers taking a definitive lead. Trading is likely to continue within the current range, bounded by the support zone of $93.2–$98.5 and the resistance zone of $106.0–$109.9.
Solana still harbors potential for a yearly high as long as it remains above the $90 threshold, keeping upward scenarios in play.
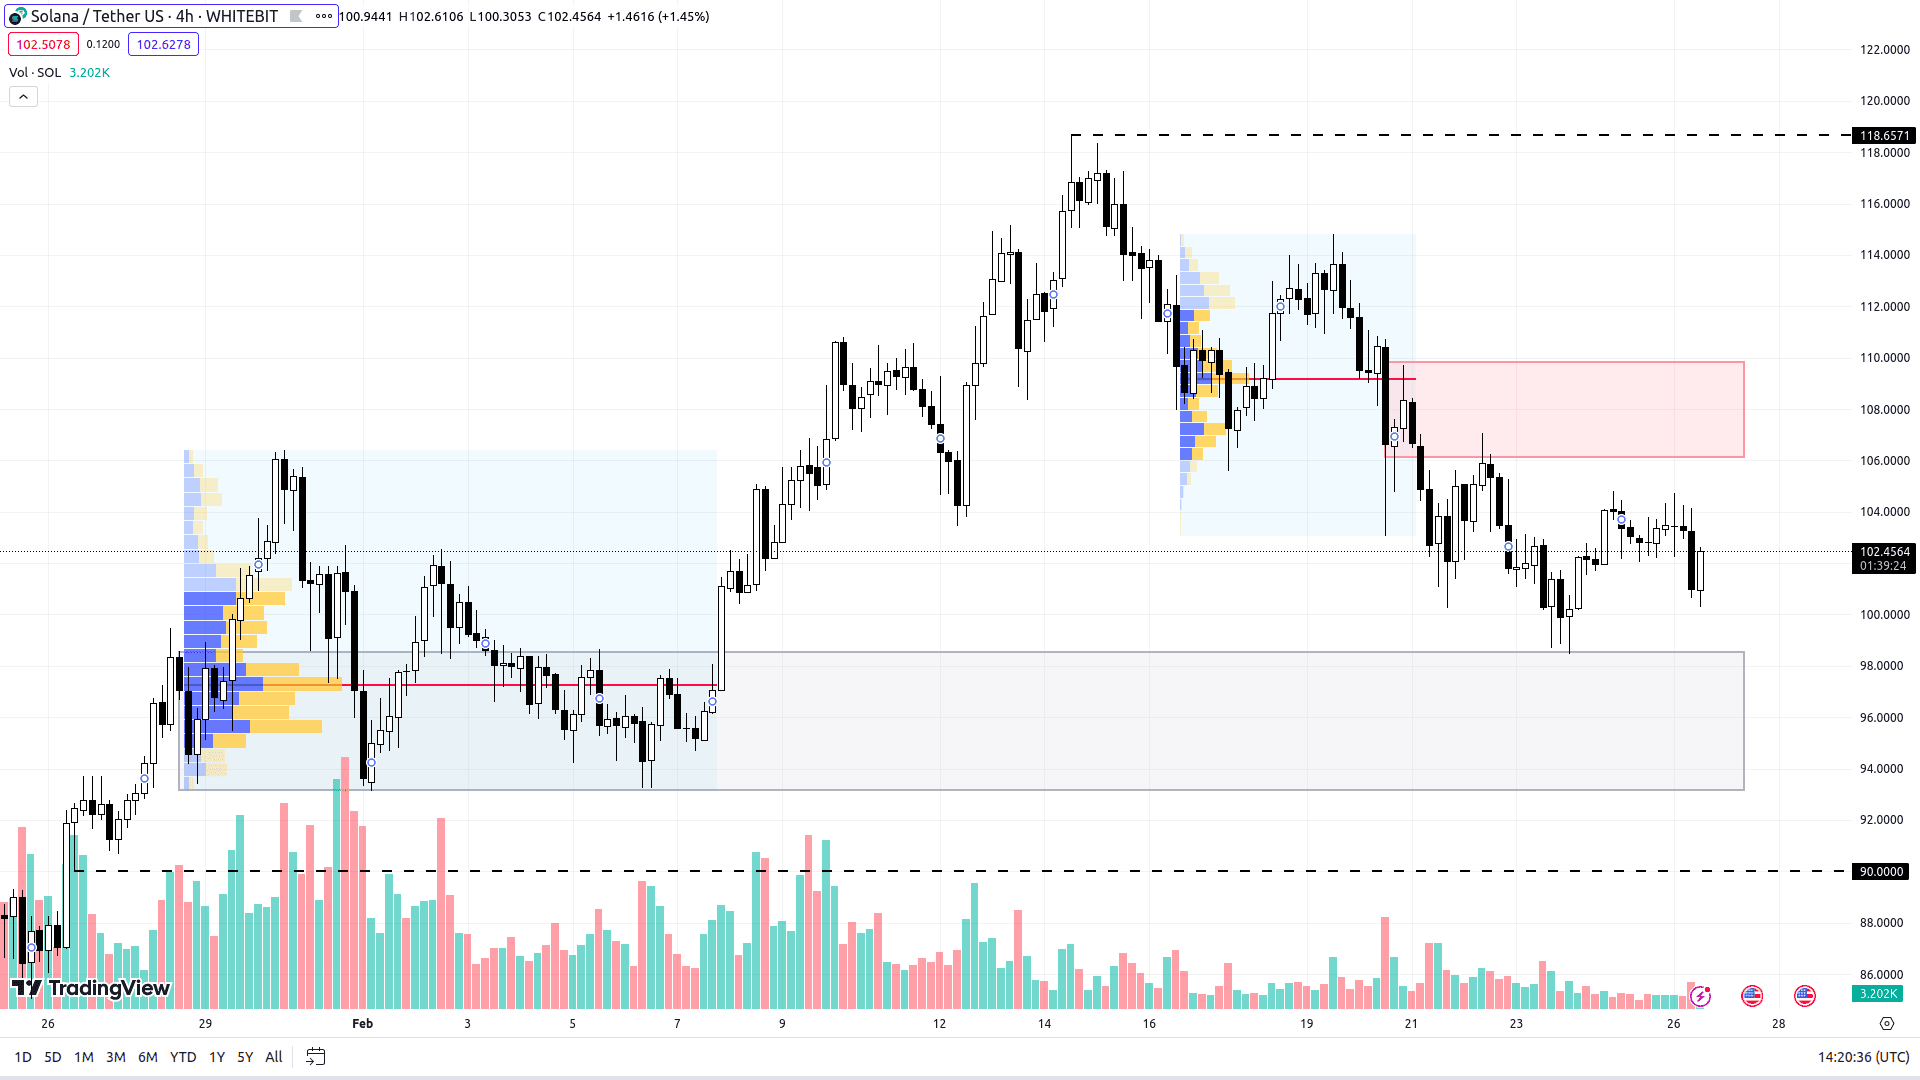
SOL Chart on H4 Timeframe
Avalanche (AVAX)
Avalanche's market behavior closely mirrors that of Solana, with the coin fluctuating between the support zone of $34.5–$36.0 and the resistance zone of $36.7–$38.7 for nearly a week.
AVAX may continue its upward trajectory as long as Bitcoin sustains above $49,000. Buyers are eyeing the $41.7 level and the significant $42 mark as immediate targets.
If Bitcoin undergoes a correction, Avalanche might test the support zone of $32.2–$33.4, potentially revisiting its local low.
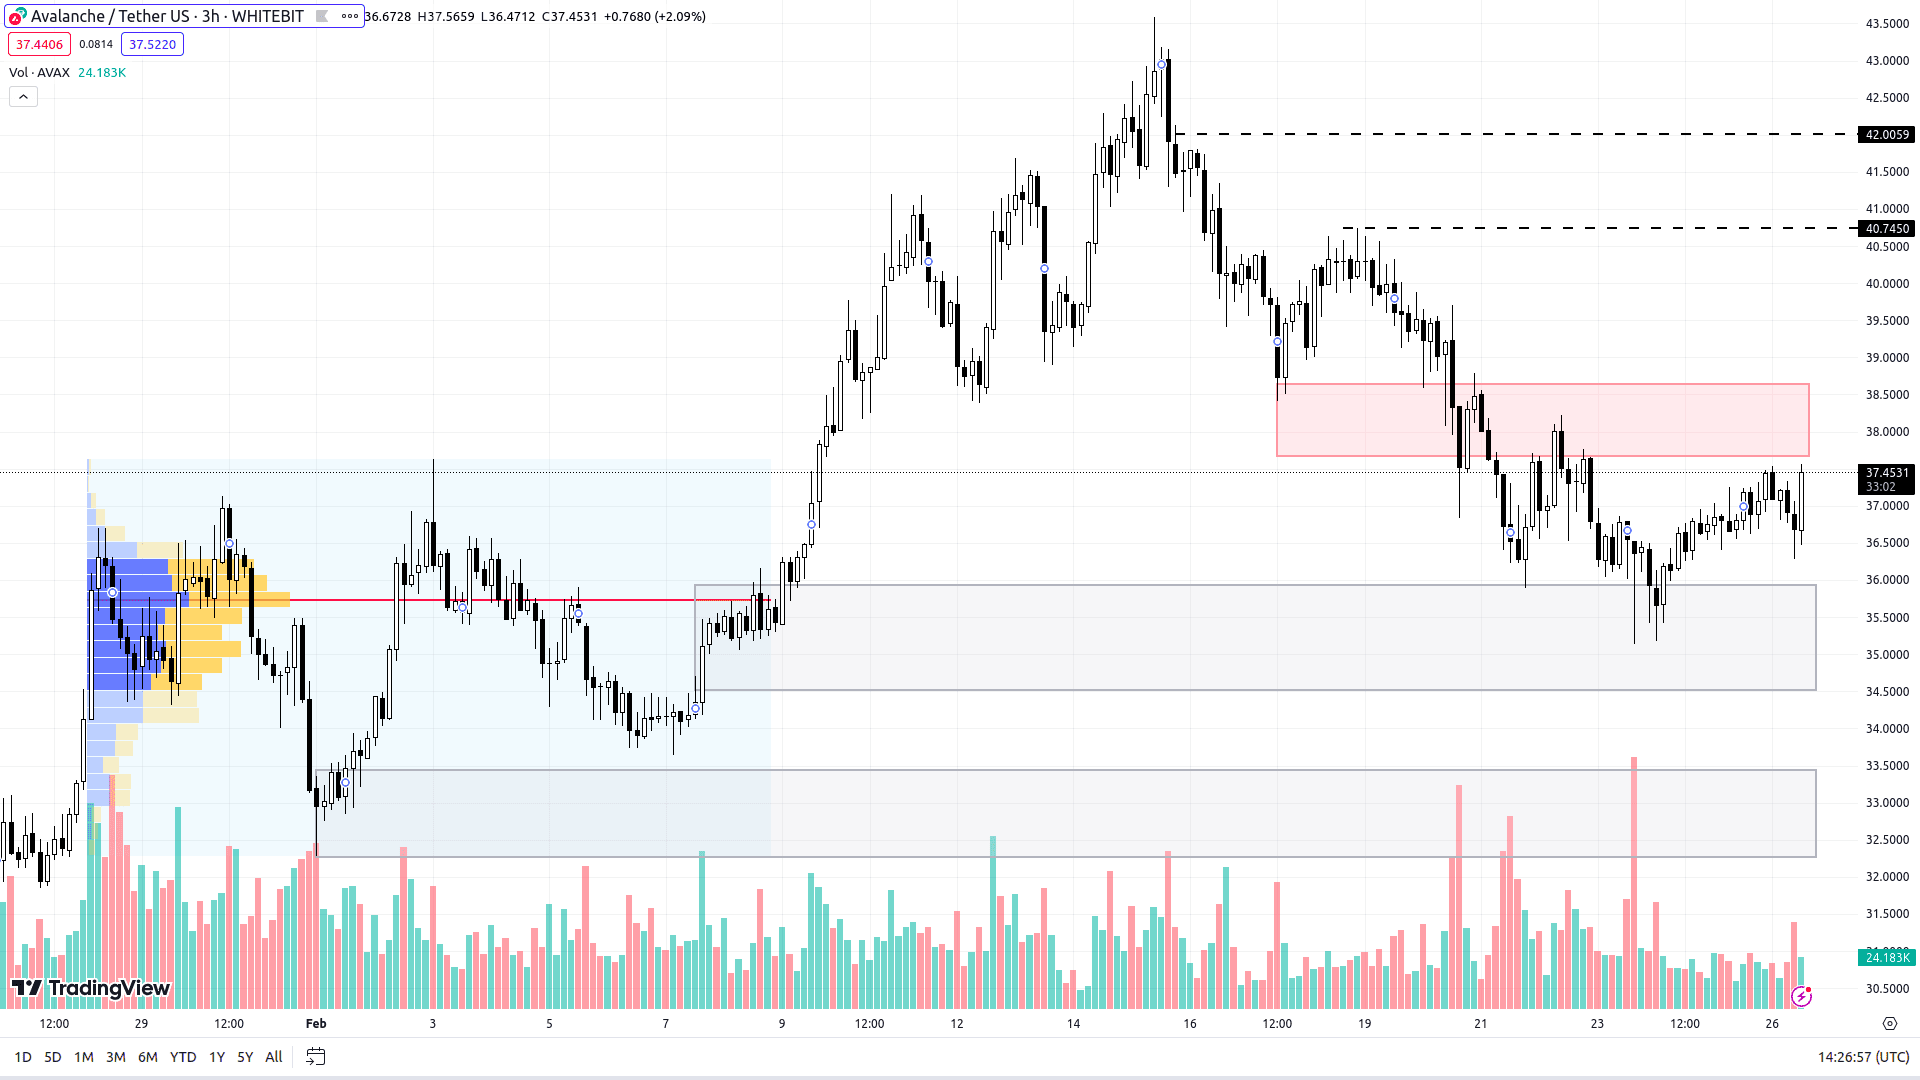
AVAX Chart on H3 Timeframe
Tron (TRX)
TRX has exhibited a remarkable upward trend since early November 2022, growing by 200% in one and a half years without major corrections, even amidst Bitcoin's dips.
The local trend also remains bullish, with a 23% increase in February, leading to a two-year high at $0.14. Tron buyers currently overpower any resistance levels.
For those contemplating market entry, potential long positions near the support zones of $0.134–$0.136 and $0.13–$0.1325 could be considered, although the probability of a decline to these levels seems low at present.
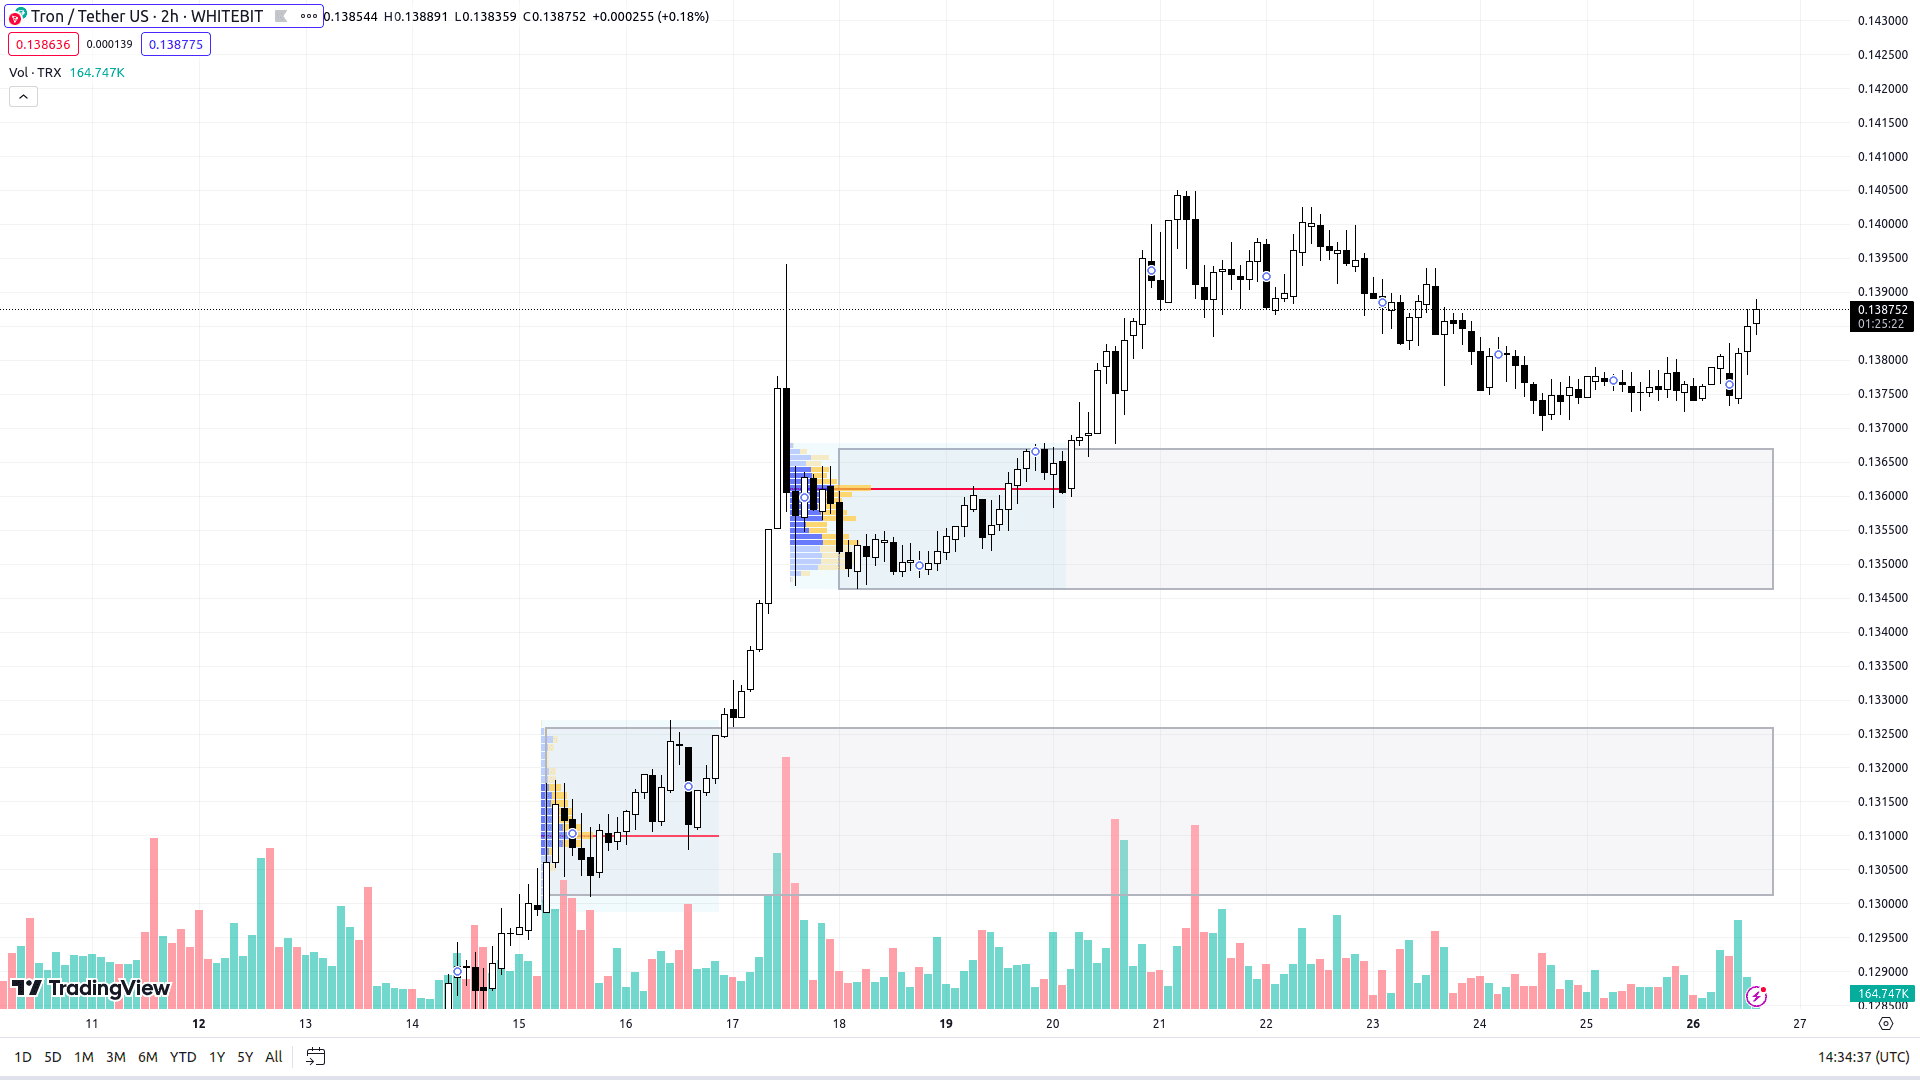
TRX Chart on H2 Timeframe
Polygon (MATIC)
The last few days have been notably positive for Polygon, with the coin extending its upward trend and solidifying its position above $1.
The trajectory suggests continued growth. Should Bitcoin maintain its stability without significant corrections, MATIC is poised to set a new yearly high above $1.09 soon.
The primary support zone is currently at $0.94–$0.97, with further buyer interest likely around $0.93 and the $0.87–$0.90 range. These levels are attractive for discount buyers, but such opportunities may not always be forthcoming.
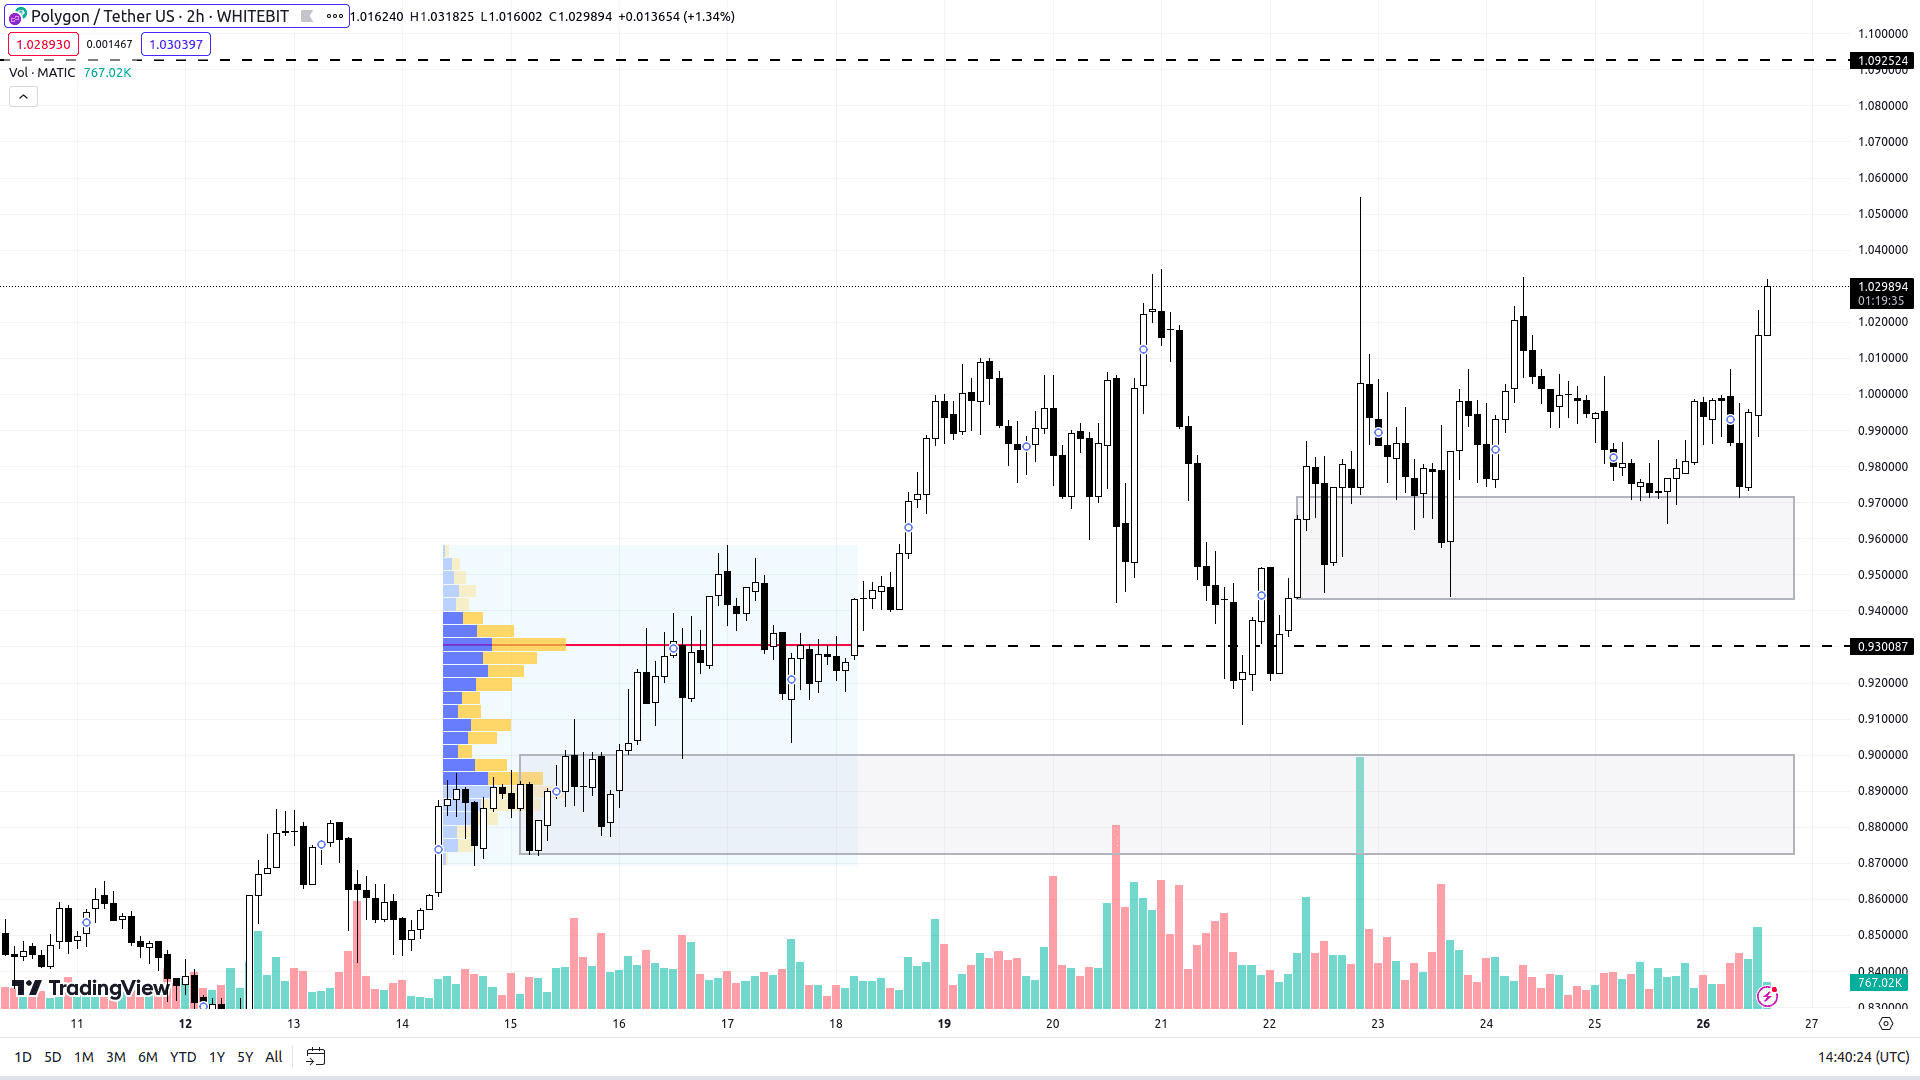
MATIC Chart on H2 Timeframe
Bitcoin Dominance, Altseason, & Fear and Greed Indices
To gauge the momentum and future potential of the crypto market's upward movement, various cryptocurrency indices offer valuable insights.
Bitcoin's dominance, at a three-year peak of 52.2%, suggests that altcoins are lagging in their growth rate, which could have negative implications, especially if Bitcoin experiences any local corrections.
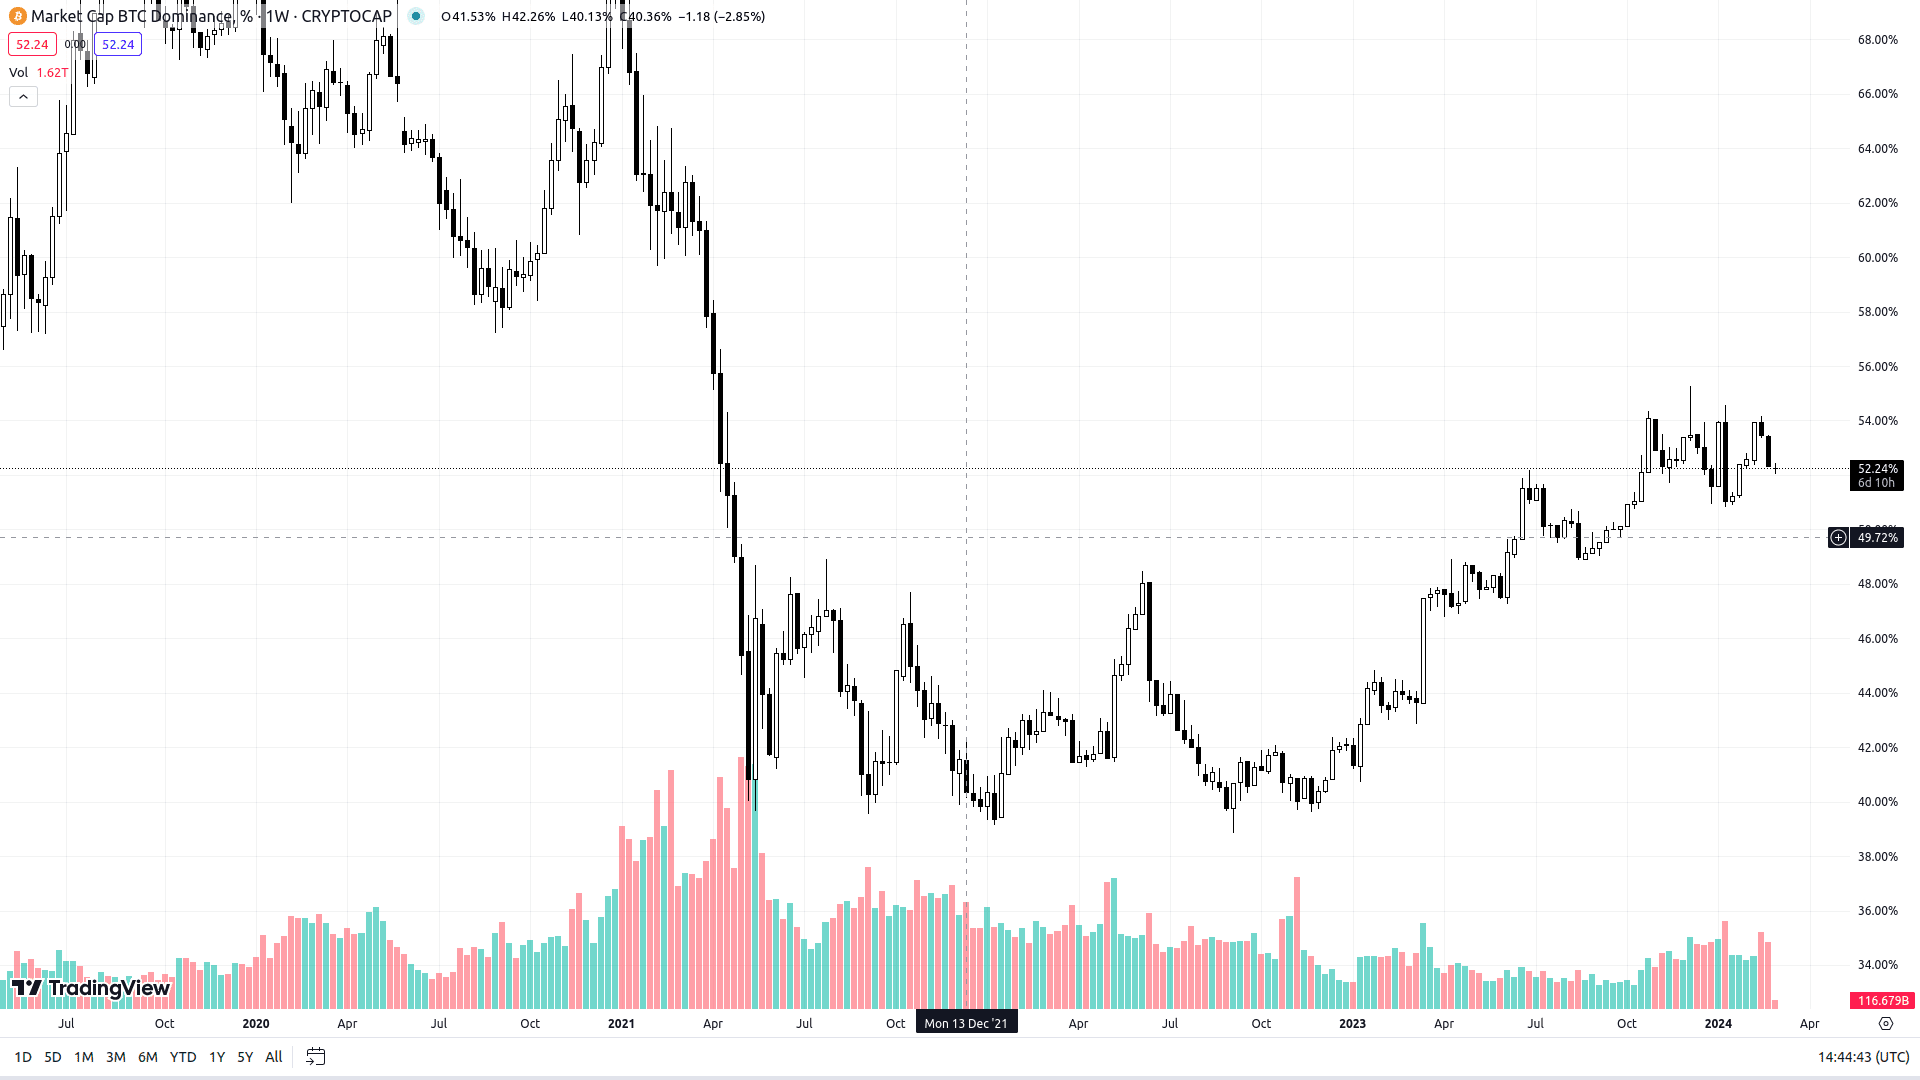
BTC Dominance Chart. Source: tradingview.com
The Altseason Index, having briefly surpassed 80, now stands at 65, indicating a lukewarm interest in altcoins among traders despite Bitcoin's ascent.
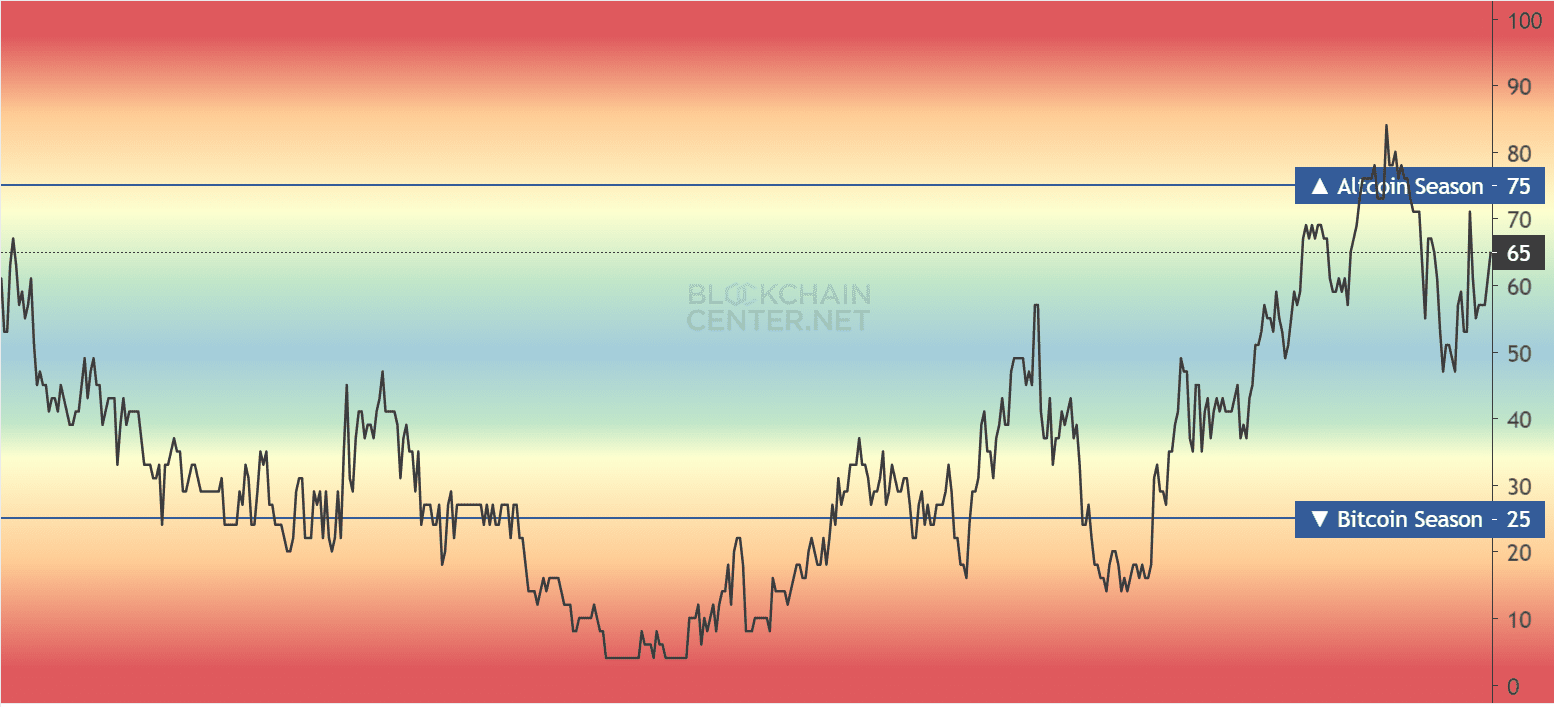
Altseason Index. Source: blockchaincenter.net
The Fear and Greed Index, consistently above 70 points, reflects a "Greed" sentiment. Traders are actively accumulating BTC and ETH but show reluctance towards other cryptocurrencies, possibly delaying the onset of an altseason. Further analysis on this trend is available in our dedicated article.
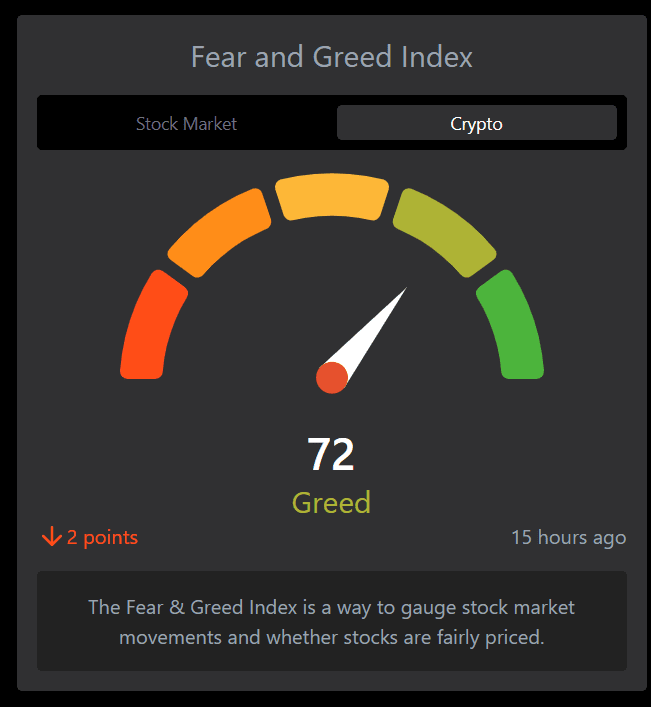
Fear and Greed Index. Source: feargreedmeter.com
Economic News of the Week
Key economic events this week include:
- U.S. Consumer Confidence Index (Tuesday, February 27);
- U.S. Q4 GDP and crude oil inventories (Wednesday, February 28);
- U.S. initial jobless claims (Thursday, February 29);
- US Manufacturing PMI (Friday, March 1).
Check out GNcrypto for the latest cryptocurrency rates and chart analysis.
Disclaimer
Please note that the analysis provided above should not be considered a trading recommendation. Before opening any deals, we strongly advise conducting your own research and analysis.
Abbreviations
TF (Timeframe) — a chronological period equal to the time it takes to form one Japanese candle on the chart.
Horizontal channel (flat, sideways, range) — the price movement between support and resistance levels, without going beyond the given range.
К — simplified designation of one thousand dollars of the asset price (for example, 23.4K – $23,400).
Gray range on the chart — a support zone.
Red range on the chart — a resistance zone.
Correlation — the tendency of prices of different cryptocurrencies to move in sync, often influenced by the dominance of one of the assets.
Initial materials
This analysis was informed by the following educational materials and articles from GNcrypto:
Recommended

