BTC, ETH and PAXG Price Analysis for November 06, 2023

Over the weekend, the crypto market experienced subdued volatility, with Bitcoin hovering around the psychological price level of $35,000. Here's an analysis of the market situation for Bitcoin (BTC), Ethereum (ETH), and Pax Gold (PAXG) as of Monday, November 6.
Bitcoin (BTC)
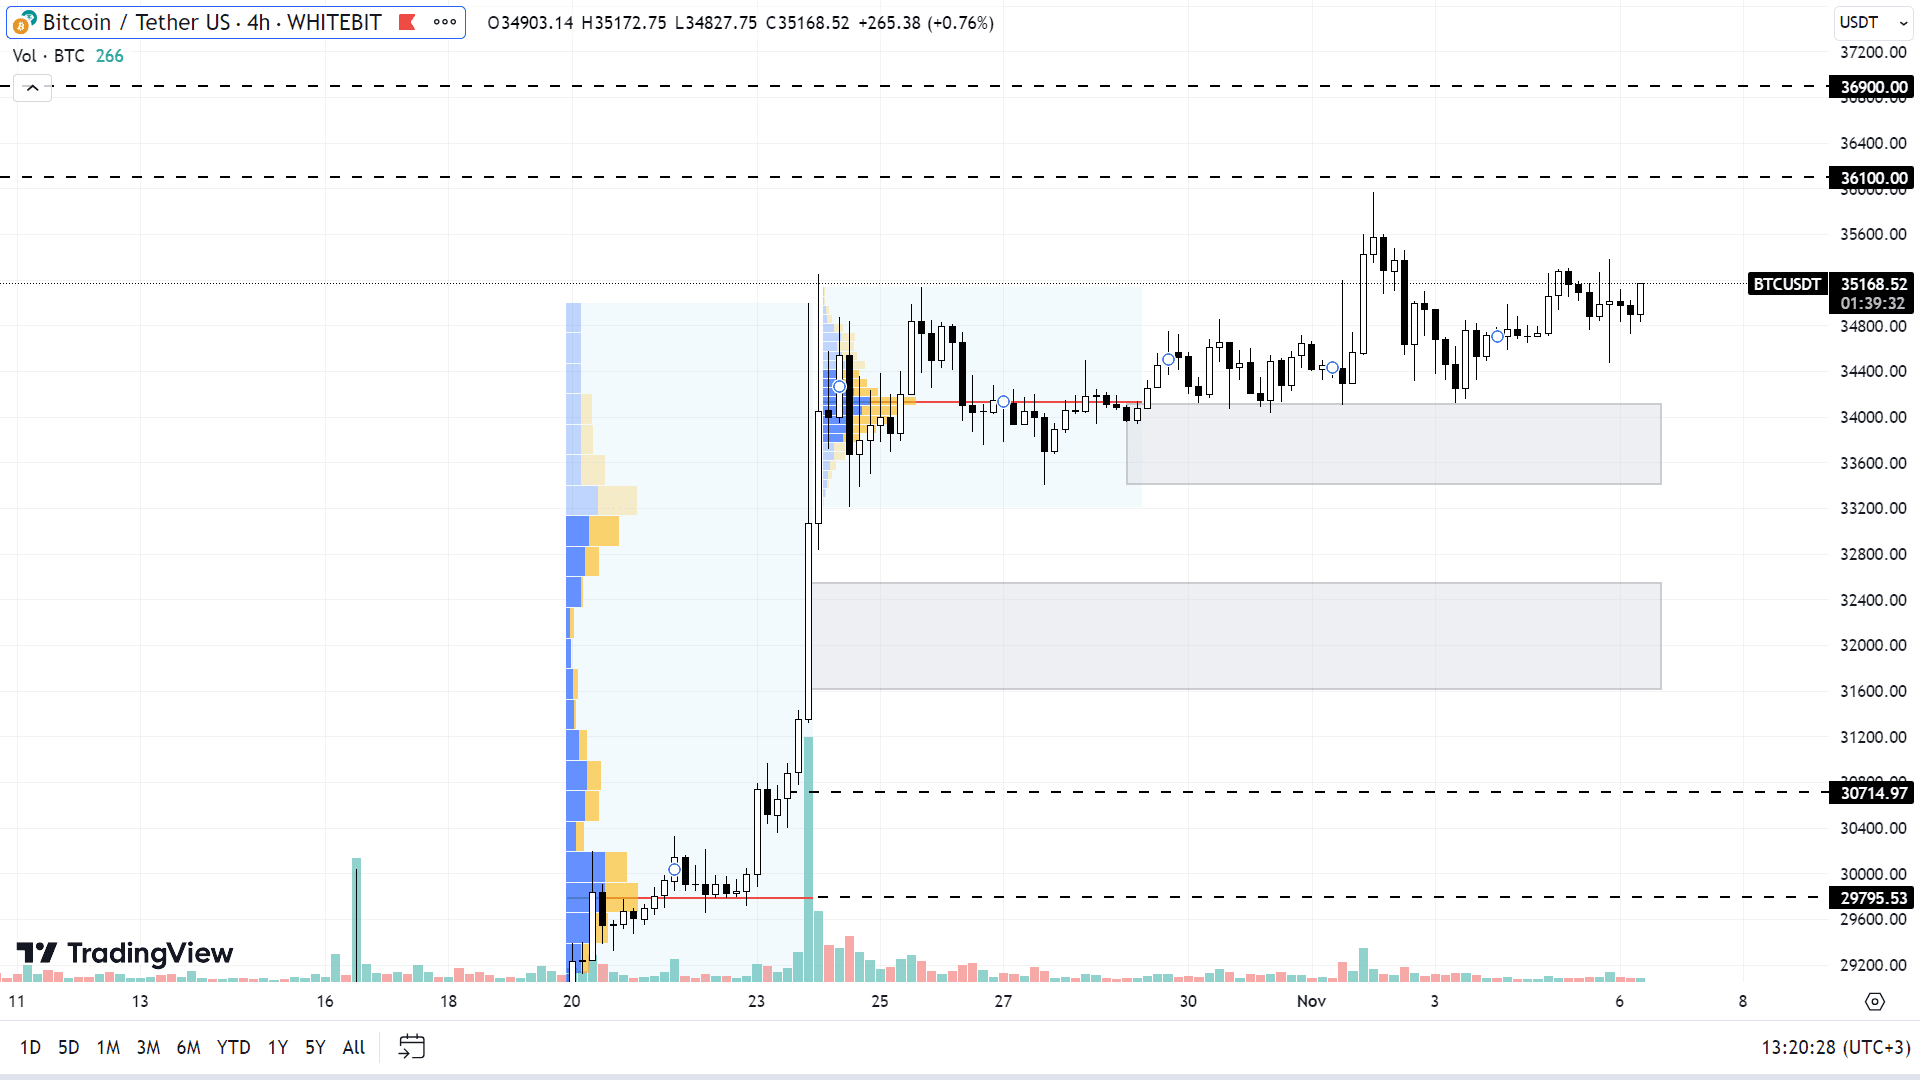
Bitcoin maintains a positive trajectory on the charts. Over the weekend, the asset reached a new yearly high, climbing above $35,970.
Continued growth for Bitcoin is the leading narrative. Key targets for buyers are currently set at $36,100 and $36,900. Market sentiment suggests that until these levels are tested, a significant pullback is unlikely.
In the event of a downward correction, BTC could test the support zones at $33,400-$34,100 and $31,600-$32,500, as well as the levels of $30,700 and $29,900. As long as the asset maintains above the $28,000 threshold, any decline should be viewed as a strategic opportunity for initiating long positions.

BTC chart on the H4 timeframe
Ethereum (ETH)
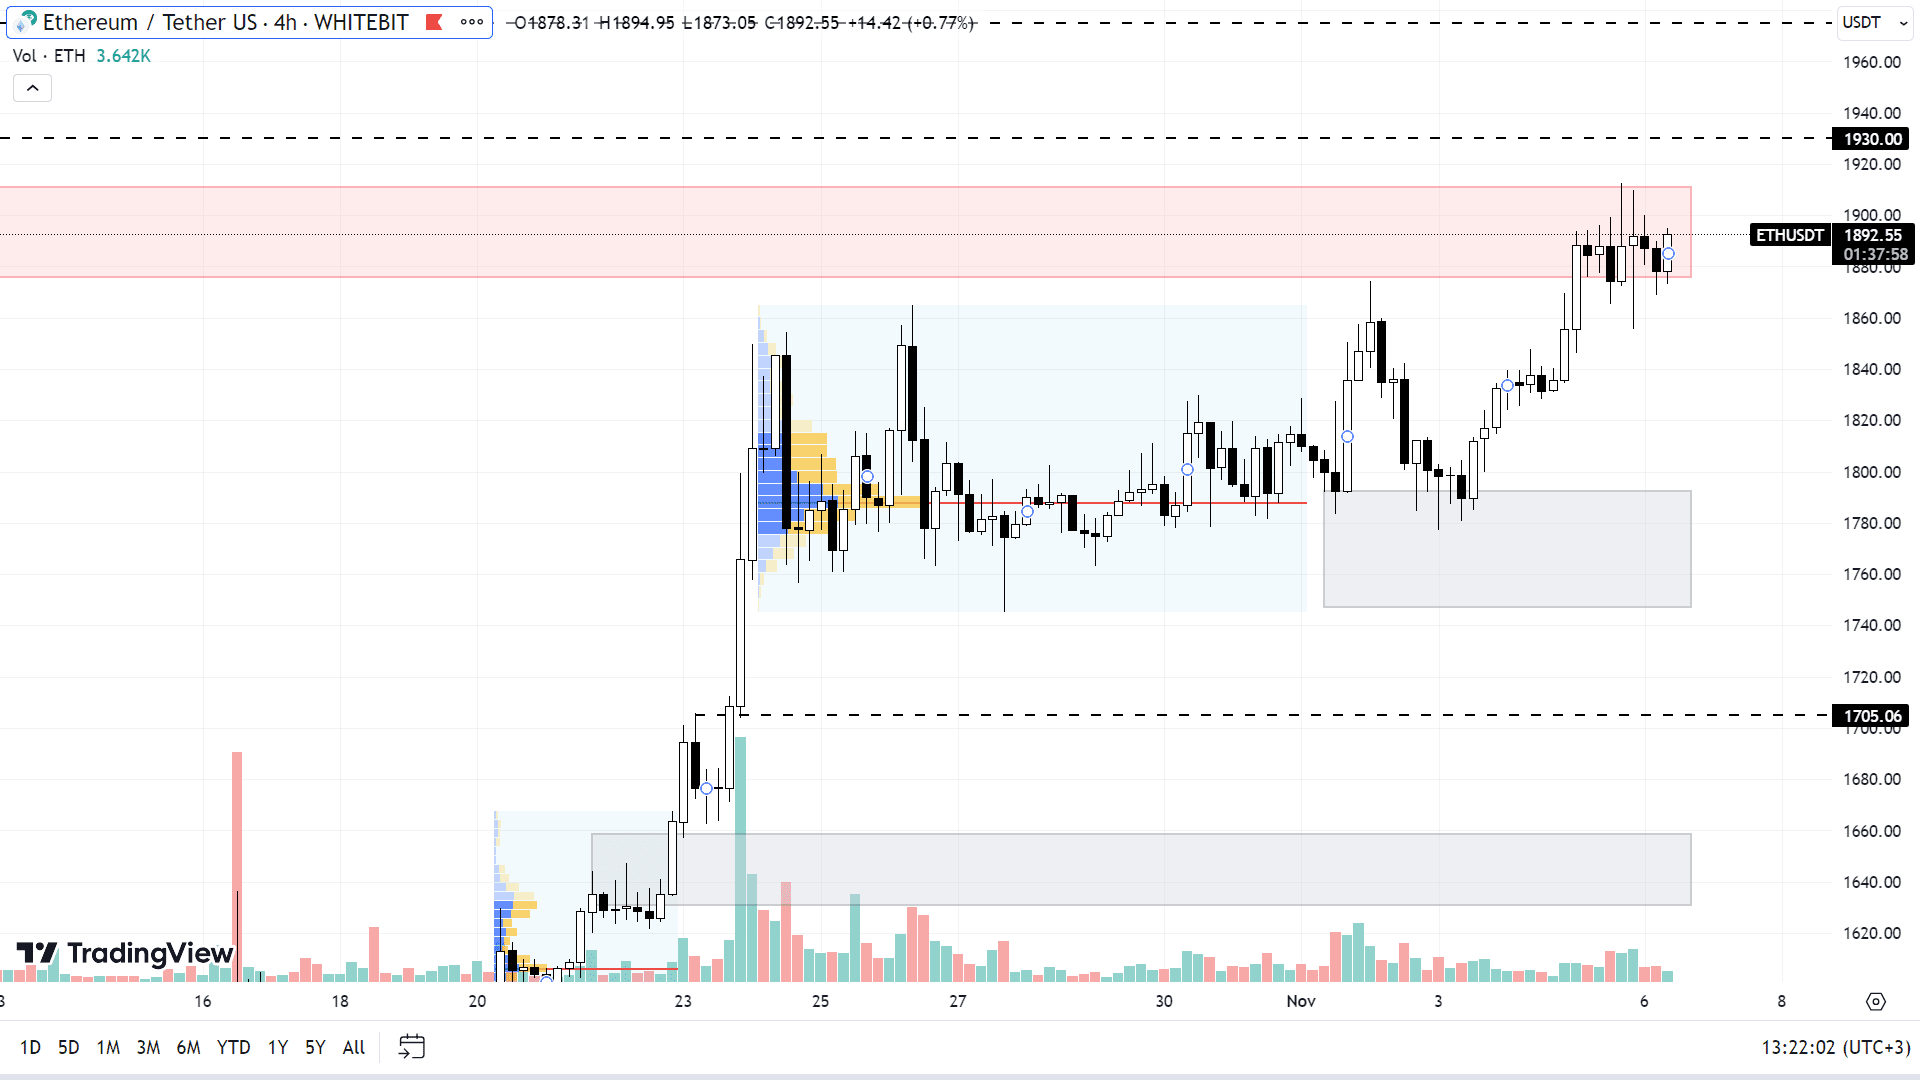
The correlation between BTC and ETH remains strong, hence both assets grow in tandem and exhibit similar dynamics. Just yesterday, Ethereum updated its local high at the $1,912 mark.
If Bitcoin continues to trade sideways within a narrow range without a distinct rise or fall, the ascending trend on the ETH chart may gain momentum. In this case, the asset might break through the current resistance zone of $1,876-$1,912 and aim for the levels of $1,930 and $1,975. For buyers, the psychological threshold of $2,000 is the ultimate goal, and securing above this level could steer the asset toward its yearly high.
On the flip side, a BTC price correction would similarly impact Ethereum's chart. Clusters of buyer orders are likely to be met within the $1,750-$1,790, $1,705, and $1,630-$1,660 zones. Testing these levels is quite possible if BTC drops to the $31,000-$32,000 range.

ETH chart on the H4 timeframe
Pax Gold (PAXG)
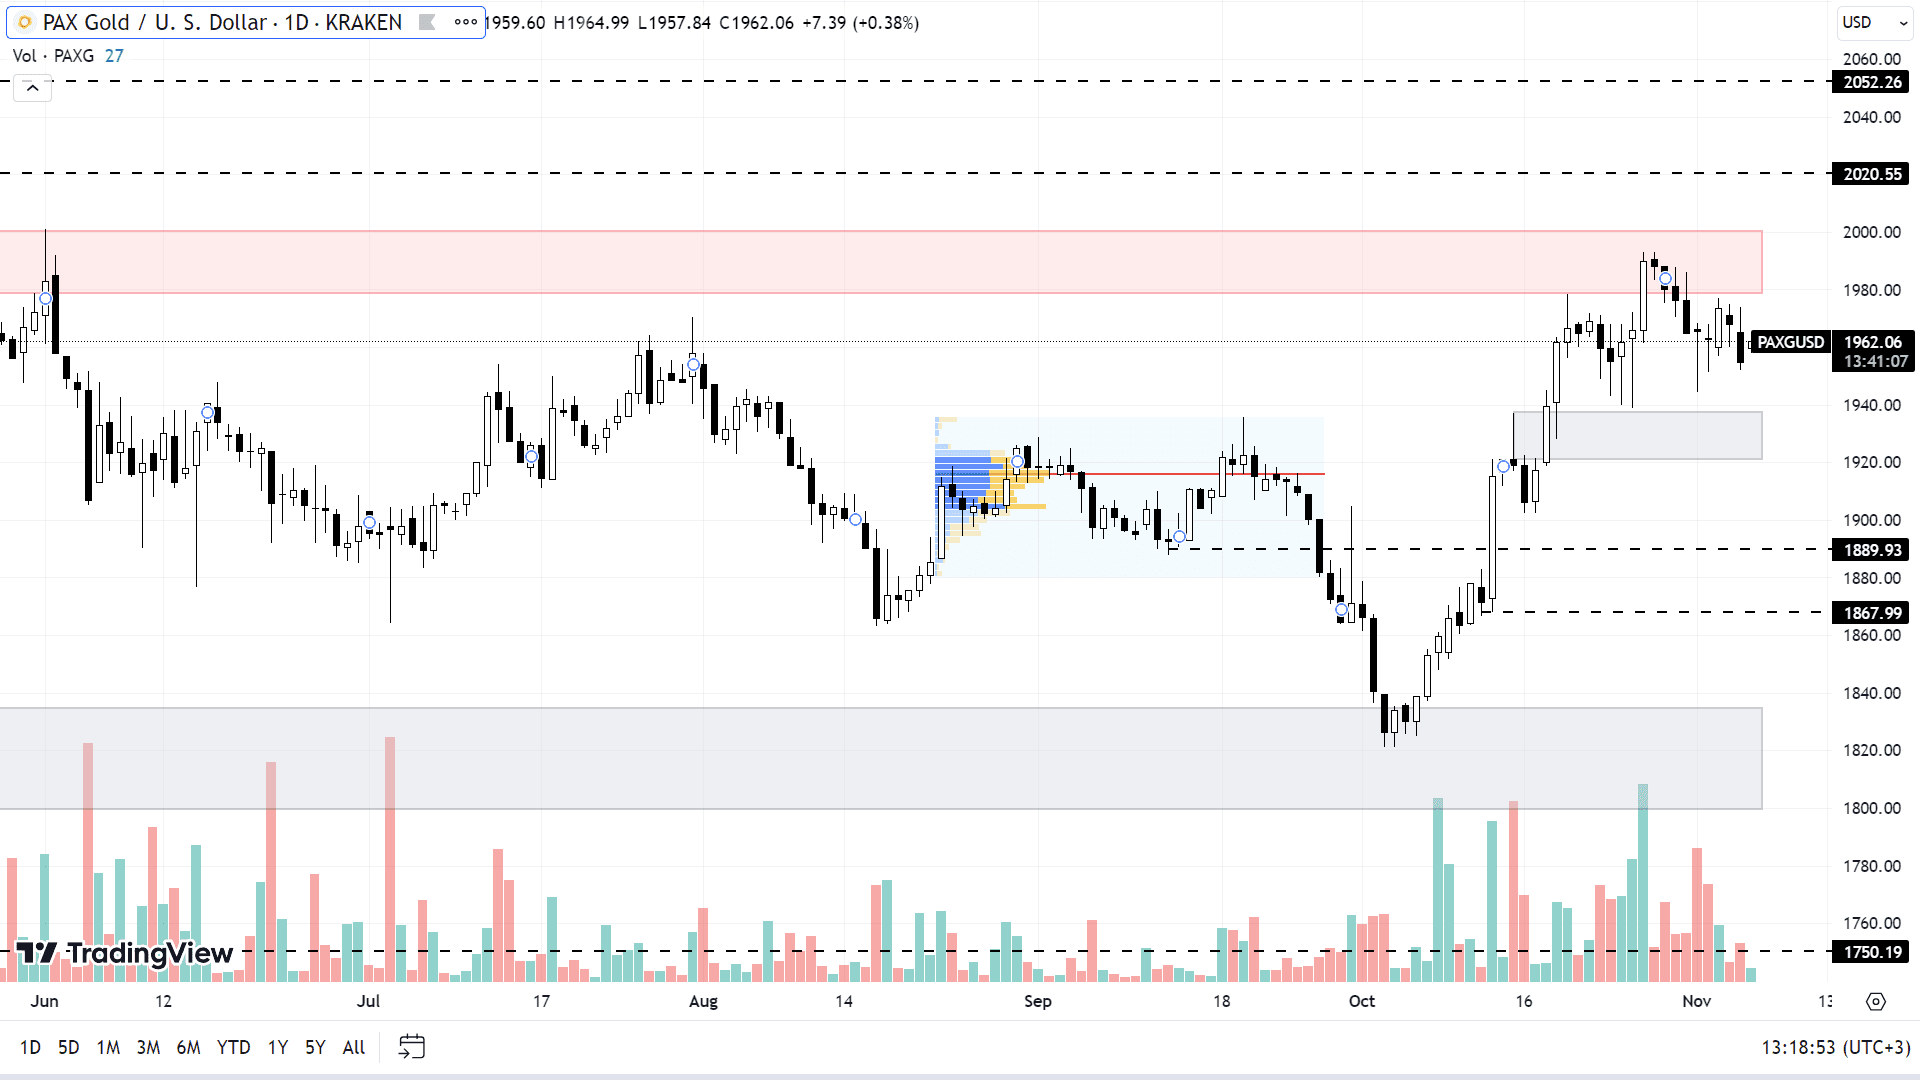
While gold on some exchanges has come close to the psychological mark of $2,000, it failed to surpass this level on the first attempt. The asset is currently trading between the support zone of $1,921-$1,937 and the resistance level of $1,978-$2,000.
The positive momentum in the PAXG chart suggests a continuation of growth is logical. Overcoming the $2,000 mark could propel Pax Gold towards the levels of $2,020 and further to the annual high of $2,051, with a potential to exceed this before the start of 2024.
Any decline in the PAXG price should be viewed as an opportunity to purchase the asset on the spot market. Beneath the current zone, buyer orders are located at levels of $1,905, $1,889, and $1,868. Testing the support zone of $1,800-$1,835 remains unlikely for now.

PAXG chart on the Daily timeframe
This week's economic calendar is filled with events such as the update on crude oil inventories (Wednesday, November 8), the number of initial jobless claims in the U.S. (Thursday, November 9), and the GDP data for the United Kingdom (Friday, November 10). While these developments might not exert a worldwide influence on cryptocurrency prices, they have the potential to prompt short-term responses in fiat currencies, which could indirectly impact the crypto market.
Check out GNcrypto for the latest cryptocurrency rates and chart analysis.
Disclaimer
Please note that the analysis provided above should not be considered a trading recommendation. Before opening any deals, we strongly advise conducting your own research and analysis.
Abbreviations
TF (Timeframe) — a chronological period equal to the time it takes to form one Japanese candle on the chart.
Horizontal channel (flat, sideways, range) — the price movement between support and resistance levels, without going beyond the given range.
К — simplified designation of one thousand dollars of the asset price (for example, 23.4K – $23,400).
Gray range on the chart — a support zone.
Red range on the chart — a resistance zone.
Correlation — the tendency of prices of different cryptocurrencies to move in sync, often influenced by the dominance of one of the assets.
Initial materials
This analysis was informed by the following educational materials and articles from GNcrypto:
Recommended

