BTC Hits a New Local Low: BTC and ETH Analysis for July 19, 2023

Yesterday, Bitcoin hit a new local low, reaching $29,542, before swiftly bouncing back into a sideways trend. We present an analysis of the market dynamics for cryptocurrencies Bitcoin (BTC) and Ethereum (ETH).
Bitcoin (BTC)
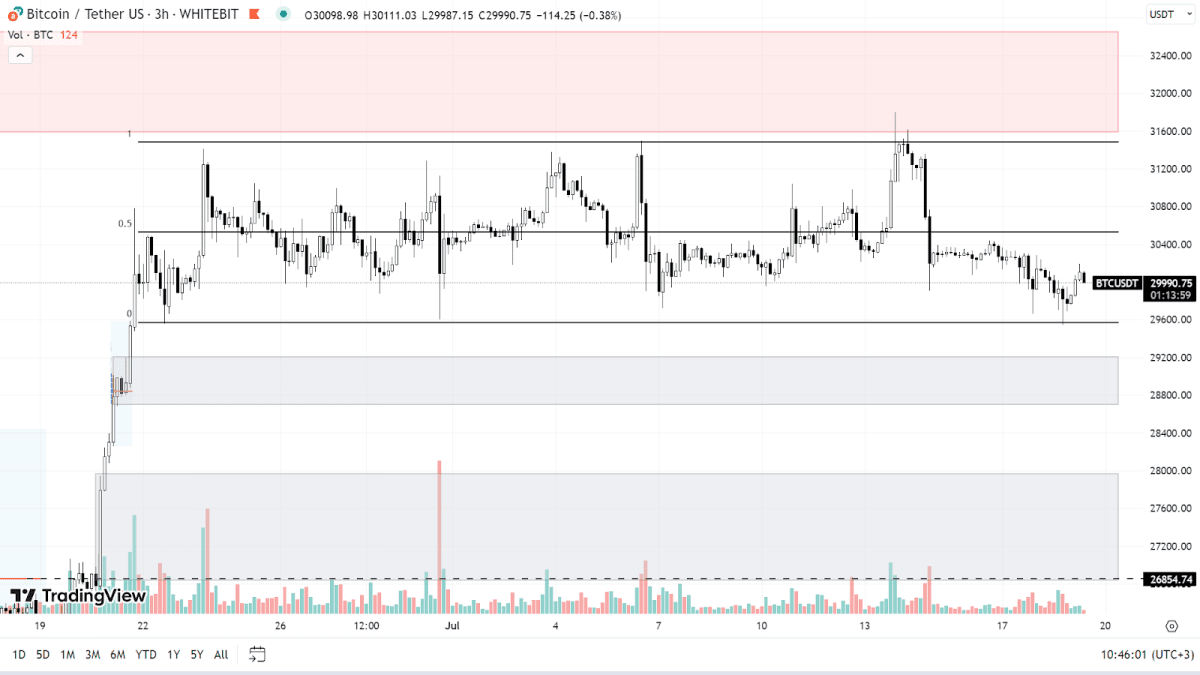
Bitcoin recently probed the lower boundary of its current range, marking a new one-month low. The cryptocurrency is currently experiencing sideways price movement, with a support level at $29,500 and resistance at $31,500. As trading volumes steadily decrease, a price correction seems to be the most likely scenario.
If the price continues to fall, the next support area lies within the $28,700-$29,200 zone. Further down, a more expansive range spans between $26,800 and $28,000. The bullish trend will remain intact as long as Bitcoin's price stays above the $25,000 mark.
Should Bitcoin manage to escape its current sideways movement and rise, its main target would be the $31,600-$32,600 zone.

BTC chart on the H3 timeframe
Ethereum (ETH)
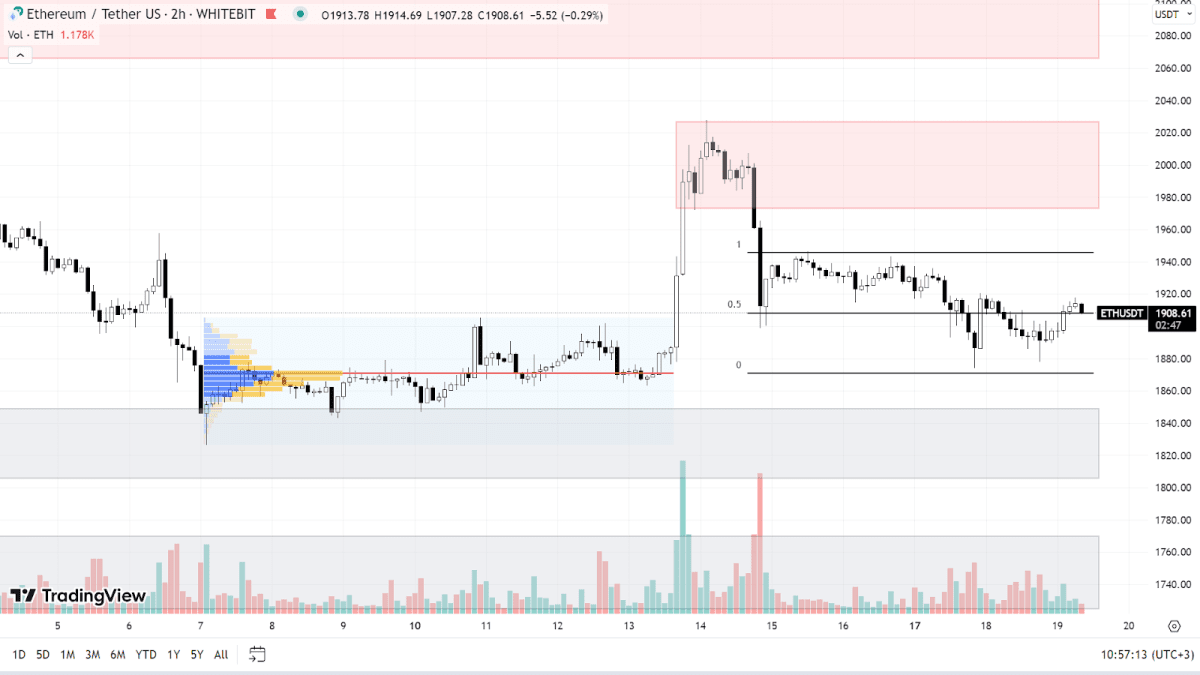
Currently, ETH is charting its own course within a sideways pattern, with the lower boundary at $1,870 and the upper boundary at $1,950. As Ethereum's correlation with Bitcoin has somewhat weakened, it's reasonable to anticipate that the upward trend could persist. In such a case, buyers would aim for the resistance thresholds of $1,973-$2,026 and $2,066-$2,141.
Should a downward correction take place, the closest support zones to watch would be $1,805-$1,850 and $1,724-$1,770. The overall outlook remains positive as long as Ethereum manages to hold above the $1,700 level.

ETH chart on the H2 timeframe
The news landscape is currently neutral. Any significant shifts in sentiment, whether positive or negative, affecting the stock or crypto markets, could set the direction for Bitcoin's price movement.
Check out GNcrypto for the latest cryptocurrency rates and chart analysis.
Disclaimer
Please note that the analysis provided above should not be considered a trading recommendation. These are solely the opinions of the GNcrypto editorial board regarding the market situation. Before opening any deals, we strongly advise conducting your own research and analysis.
Abbreviations
TF (Timeframe) — a chronological period equal to the time it takes to form one Japanese candle on the chart.
Horizontal channel (flat, sideways, range) — the movement of price between support and resistance levels, without going beyond the given range.
К — simplified designation of one thousand dollars of the asset price (for example, 23.4K - $23,400).
Gray range on the chart — a support zone.
Red range on the chart — a resistance zone.
Correlation — the tendency of prices of different cryptocurrencies to move in sync, often influenced by the dominance of one of the assets.
Initial materials
This analysis was informed by the following educational materials and articles from GNcrypto:
Recommended

