Crypto Trends for the Weekend. BTC and ETH Analysis for 22/09/23

After reaching a local high at $27,500, BTC has once again slipped below $27,000, where it remains presently. We present a market breakdown for Bitcoin (BTC) and Ethereum (ETH) as of Friday, September 22.
Bitcoin (BTC)
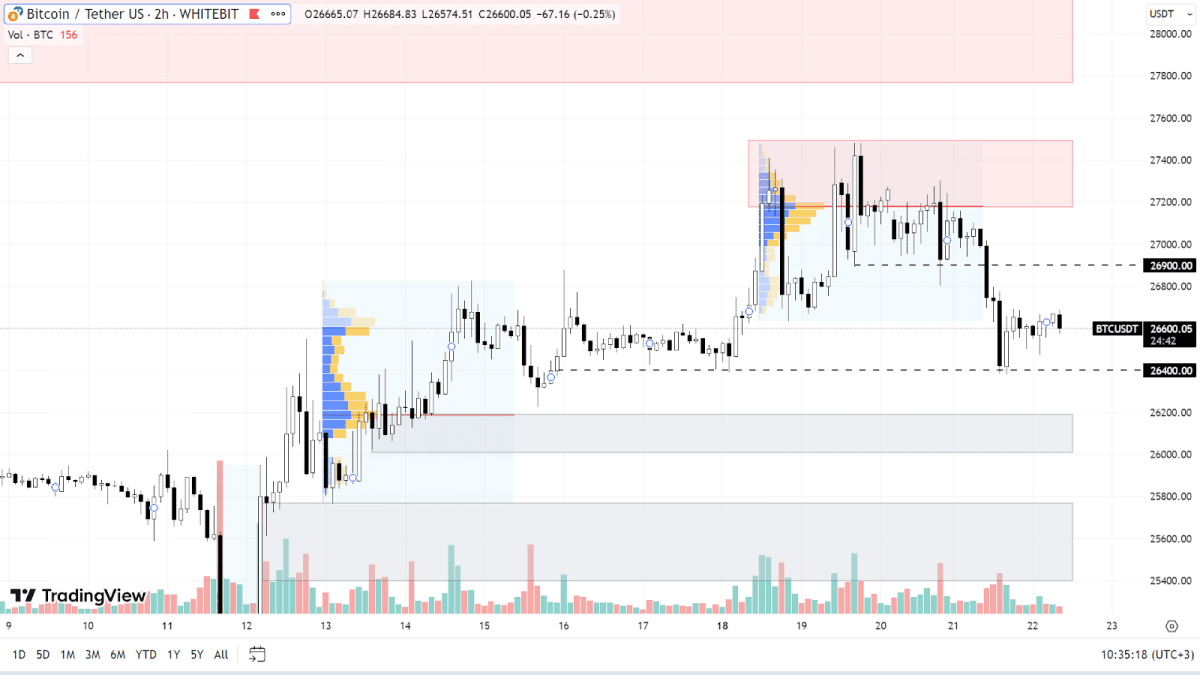
Bitcoin has attempted to stabilize above the $27,000 level three times, but all have been futile. Currently, the asset is fluctuating between the support level of $26,400 and the resistance zone of $27,200-$27,500. Should the correction continue, the coin may approach the support zone of $26,000-$26,200 and may further descend to the range of $25,400-$25,750.
To escape the local downward trend, BTC must traverse the current sellers’ zone ($27,200-$27,500) and consolidate above the subsequent one, which lies between the price levels of $27,750-$28,200.
Over the weekend, slight volatility is expected, with BTC likely moving within the bounds set by the buyer's level at $26,400 and the intermediate seller's level at $26,900.

BTC chart on the H2 timeframe
Ethereum (ETH)
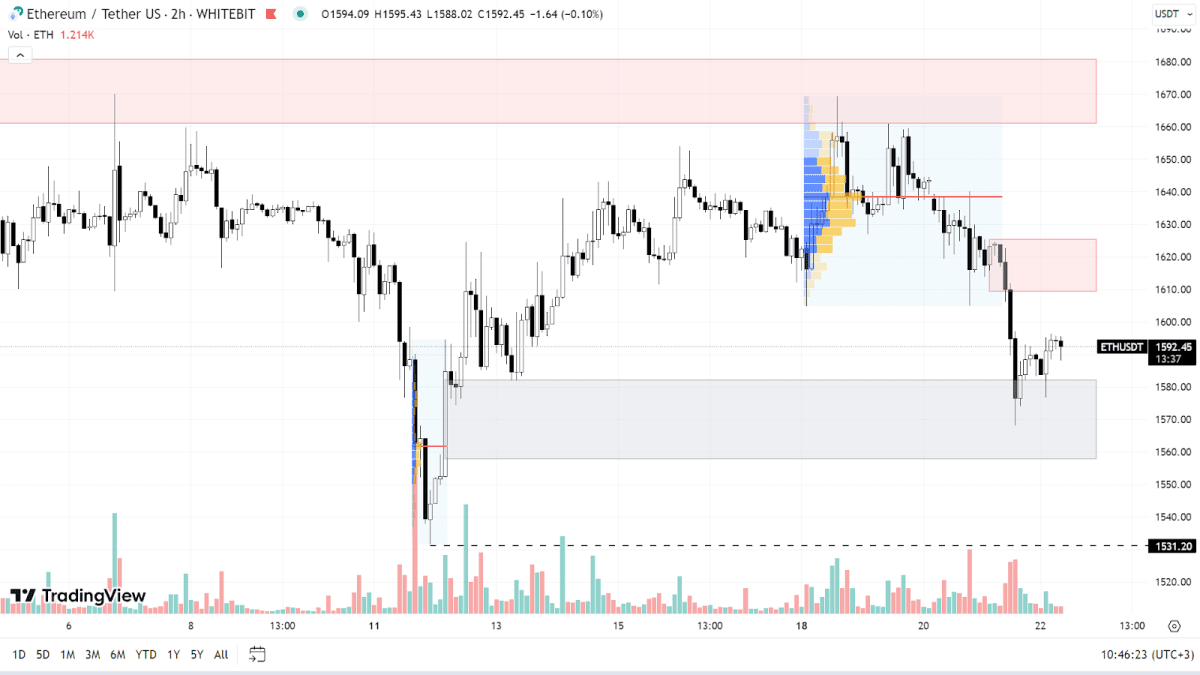
While the correlation between Ethereum and BTC continues to be strong, the ETH chart is exhibiting somewhat higher volatility. ETH was unable to surpass the resistance zone between $1,660-$1,680 and subsequently fell by 5%, landing in the buyer's zone between $1,557 and $1,582.
At present, ETH is trading within the current support and resistance zone of $1,610-$1,625. If buyers do not show strength soon, Ethereum might test the $1,531 level again and set a new local low.
To alter the local trend from descending to ascending, ETH must break through multiple seller zones and establish itself above the $1,750 level. Until that occurs, further decline remains the most probable scenario.

ETH chart on the H2 timeframe
Typically, financial markets exhibit minimal activity over the weekends, so lower volatility is expected in cryptocurrency charts on Saturday and Sunday.
Check out GNcrypto for the latest cryptocurrency rates and chart analysis.
Disclaimer
Please note that the analysis provided above should not be considered a trading recommendation. These are solely the opinions of the GNcrypto editorial board regarding the market situation. Before opening any deals, we strongly advise conducting your own research and analysis.
Abbreviations
TF (Timeframe) — a chronological period equal to the time it takes to form one Japanese candle on the chart.
Horizontal channel (flat, sideways, range) — the movement of price between support and resistance levels, without going beyond the given range.
К — simplified designation of one thousand dollars of the asset price (for example, 23.4K – $23,400).
Gray range on the chart — a support zone.
Red range on the chart — a resistance zone.
Correlation — the tendency of prices of different cryptocurrencies to move in sync, often influenced by the dominance of one of the assets.
Initial materials
This analysis was informed by the following educational materials and articles from GNcrypto:
Recommended

