Crypto Trends for the Weekend. BTC and ETH Analysis for 29/09/23

Yesterday, Bitcoin hit a new weekly high at $27,300 but failed to surpass the prevailing resistance zone. We present a market breakdown for Bitcoin (BTC) and Ethereum (ETH) as of Friday, September 29.
Bitcoin (BTC)
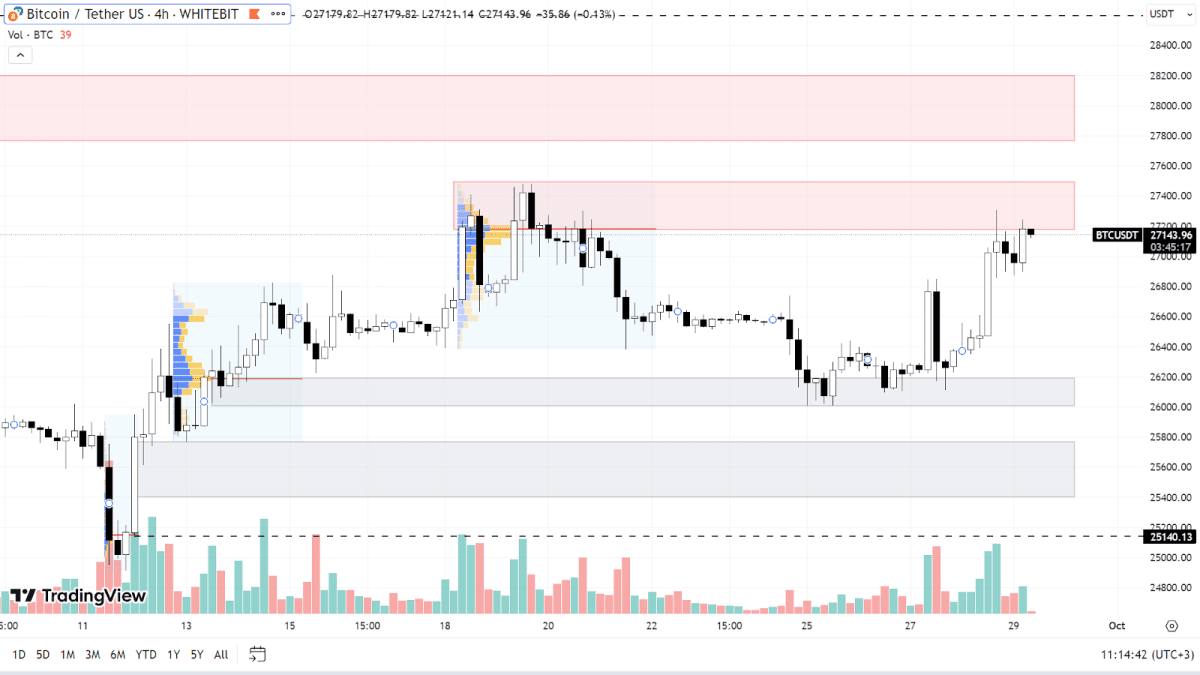
This week, Bitcoin exhibited minimal volatility, navigating between support zones of $26,000–$26,200 and resistance zones of $27,200–$27,500. At the moment, BTC is attempting to climb higher, but buyers are remarkably inactive.
Should Bitcoin manage to breach the existing seller's zone, it has the potential to approach the resistance levels of $27,750–$28,200 and $28,600. Securing a position above this last level would indicate a shift in the local market trend to an upward trajectory.
On the other hand, if a corrective movement ensues, BTC may refresh its local low within the support zone of $25,400–$25,750 and at the level of $25,140. In the absence of unfavorable news, consolidation of BTC’s price below $25,000 appears unlikely.

BTC chart on the H4 timeframe
Ethereum (ETH)
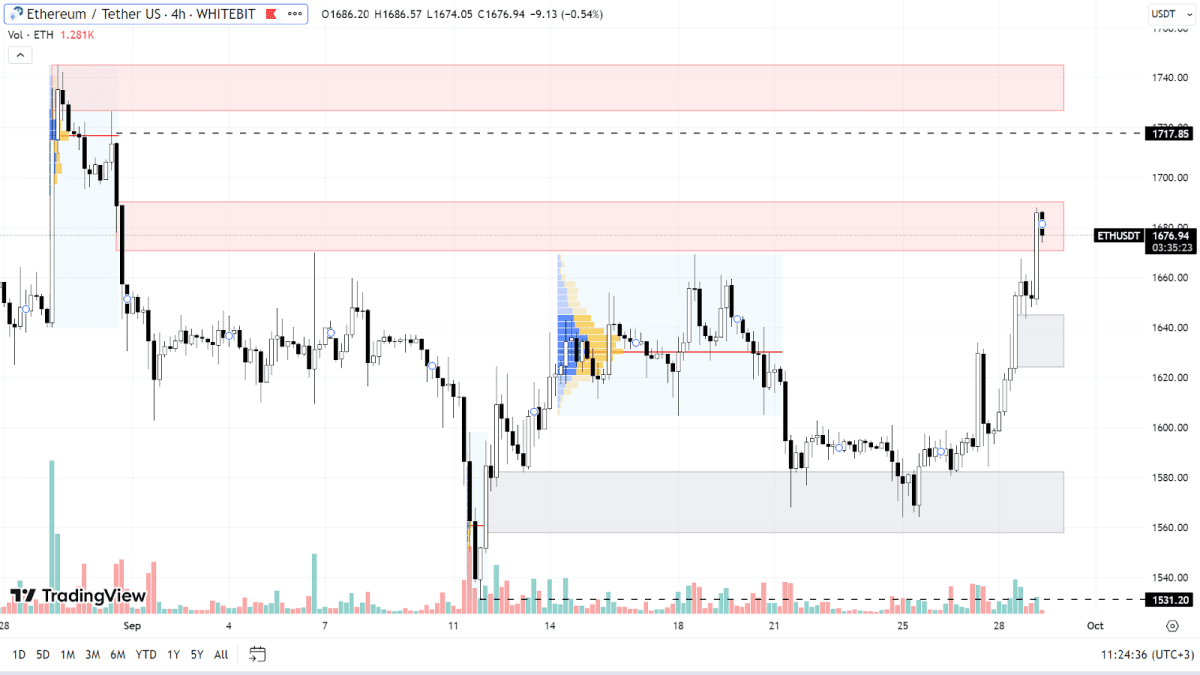
The correlation between Ethereum and BTC remains high. Currently, ETH is testing the support zone of $1,670–$1,690. If buyers can assert strength, the asset may traverse this range and test the resistances at $1,718 and $1,726–$1,745. However, we can only consider the downward trend in ETH to be over once the price is securely above $1,800.
The prevailing support zone is $1,625–$1,645. Below this, buyer orders are positioned within the $1,557–$1,582 zone and at the level of $1,531. In the event of a substantial drop in BTC, ETH might reach new local lows, where the most robust support continues to be the psychological marker of $1,500.

ETH chart on the H4 timeframe
Weekends in the cryptocurrency market typically proceed with reduced volatility. If BTC maintains its trade within the existing support and resistance zones, we can anticipate a tranquil weekend with no dramatic fluctuations in the charts.
Check out GNcrypto for the latest cryptocurrency rates and chart analysis.
Disclaimer
Please note that the analysis provided above should not be considered a trading recommendation. These are solely the opinions of the GNcrypto editorial board regarding the market situation. Before opening any deals, we strongly advise conducting your own research and analysis.
Abbreviations
TF (Timeframe) — a chronological period equal to the time it takes to form one Japanese candle on the chart.
Horizontal channel (flat, sideways, range) — the movement of price between support and resistance levels, without going beyond the given range.
К — simplified designation of one thousand dollars of the asset price (for example, 23.4K – $23,400).
Gray range on the chart — a support zone.
Red range on the chart — a resistance zone.
Correlation — the tendency of prices of different cryptocurrencies to move in sync, often influenced by the dominance of one of the assets.
Initial materials
This analysis was informed by the following educational materials and articles from GNcrypto:
Recommended

