Crypto's Monday Outlook: BTC and ETH Chart Analysis. 19/06/23

Analysis of the current state of Bitcoin (BTC), Ethereum (ETH). 19/06/23
Bitcoin
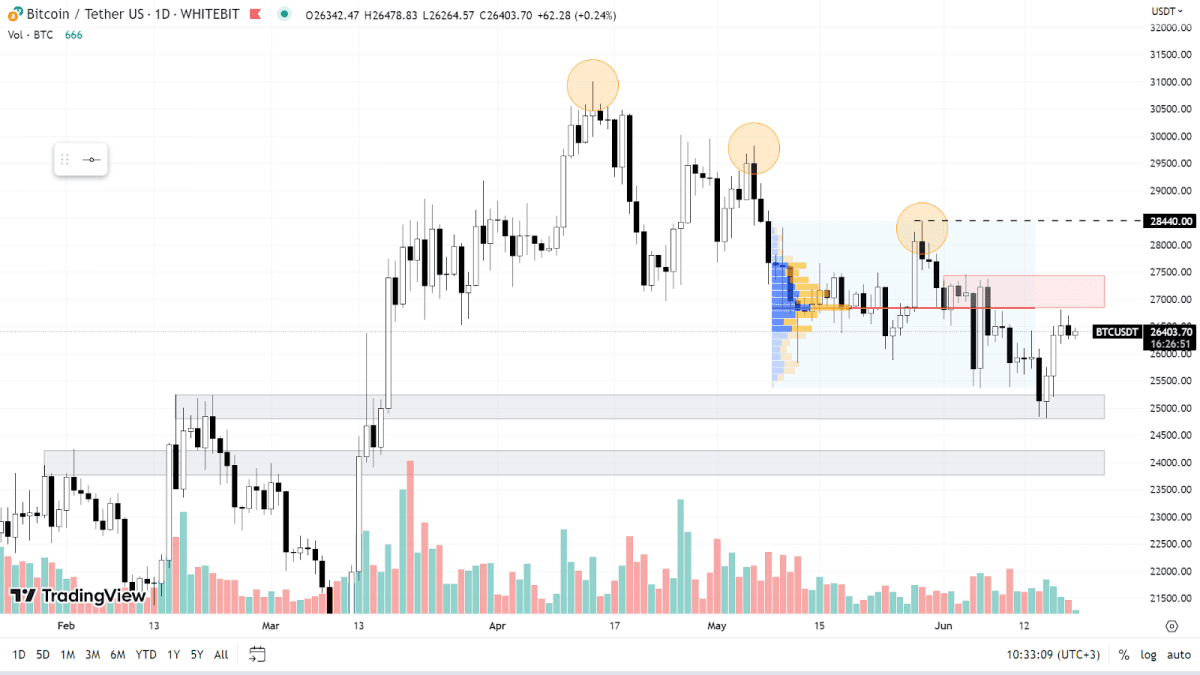
Buyers showcased resilience over the weekend, allowing Bitcoin to rebound from its local bottom at $24,800, and boosting the price to $26,800. Currently, the asset is navigating near a resistance zone between $26,800 and $27,400. If Bitcoin sustains this uptrend, the next anticipated batch of sell orders could emerge around the $28,440 mark. A breach of this level might pave the way toward $30,000.
However, despite these positive short-term movements, Bitcoin remains enmeshed in a downward trend characterized by consistently lower lows and diminishing local highs, as marked in yellow on the chart. To establish a pronounced upward trend, buyers need to solidify their footing above the $28,440 level with substantial trading volumes. If this does not occur, we could reasonably expect a retest of the $24,800-$25,200 support area and a potential new low at $24,000.

BTC chart on the 1D timeframe
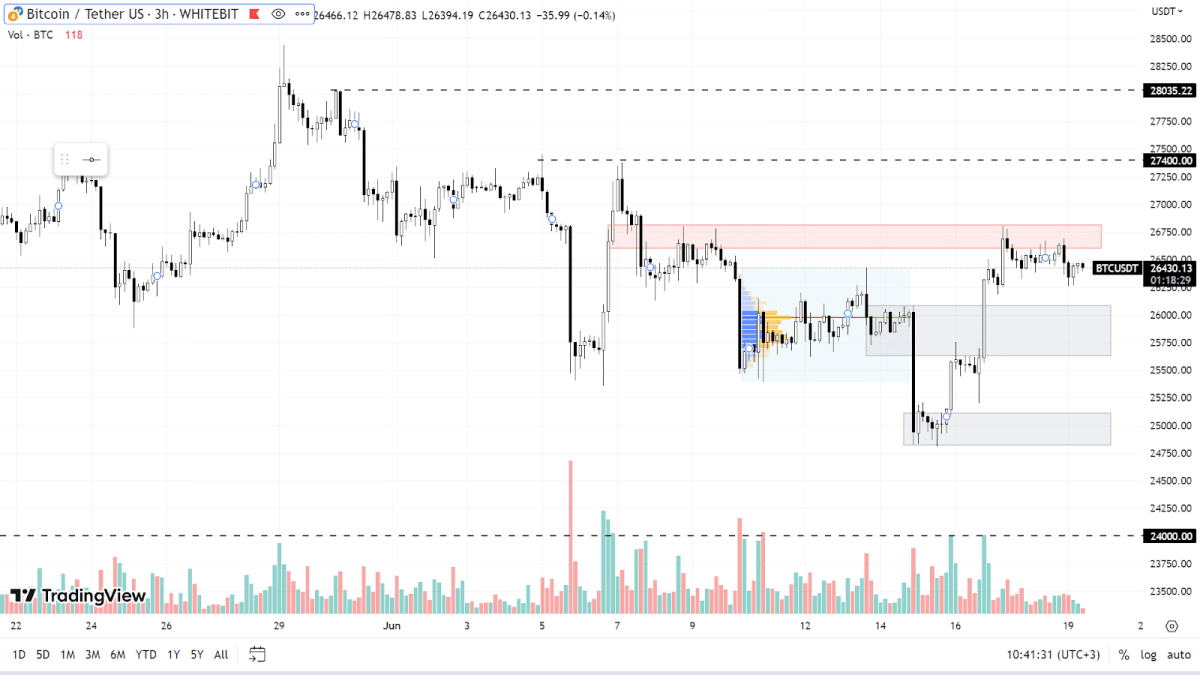
When looking closely at the H3 timeframe, we can identify a support zone between $25,600 and $26,100, which is likely to trigger a response in case of a slight dip. There are additional support zones situated between $24,800 and $25,100 and at $24,000.
The prevailing resistance currently lies between $26,600 and $26,800. If this resistance range is breached, we can expect a seller response at the $27,400 and $28,000 levels.

BTC chart on the H3 timeframe
Ethereum (ETH)
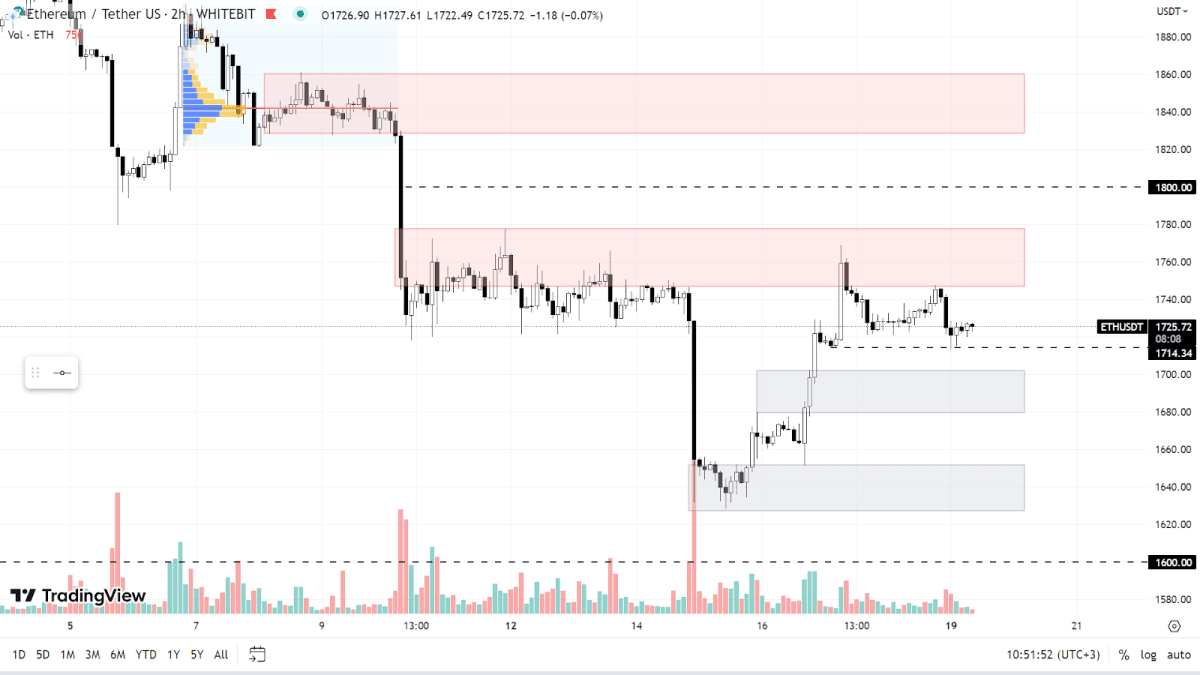
ETH's market situation aligns closely with that of BTC. On the H3 chart, it's currently trading near the resistance area ranging from $1,746 to $1,777. Potential zones where significant sell orders might be placed include the $1,800 psychological mark and the range between $1,828 and $1,860.
The nearest possible support for the buyers stands at $1,714. Below this, we can see support areas in the $1.680-$1.700 range and at the local low between $1,627 and $1,651. Should the downward trend persist, the price could likely drop to the $1,600 mark.

ETH chart on the H3 timeframe
Check out GNcrypto for the latest cryptocurrency rates and chart analysis.
Disclaimer
Please note that the analysis provided above should not be considered a trading recommendation. These are solely the opinions of the GNcrypto editorial board regarding the market situation. Before opening any deals, we strongly advise conducting your own research and analysis.
Abbreviations
TF (Timeframe) — a chronological period equal to the time it takes to form one Japanese candle on the chart.
Horizontal channel (flat, sideways, range) — the movement of price between support and resistance levels, without going beyond the given range.
К — simplified designation of one thousand dollars of the asset price (for example, 23.4K - $23,400).
Gray range on the chart — a support zone.
Red range on the chart — a resistance zone.
Correlation — the tendency of prices of different cryptocurrencies to move in sync, often influenced by the dominance of one of the assets.
Initial materials
This analysis was informed by the following educational materials and articles from GNcrypto:
Recommended

