DOGE and ADA: Altcoin Analysis for September 28, 2023

Bitcoin's price volatility remains low, with no significant changes observed from our previous analysis. Here’s a detailed review of the market conditions for cryptocurrencies Dogecoin (DOGE) and Cardano (ADA) as of Thursday, September 28.
Cardano (ADA)
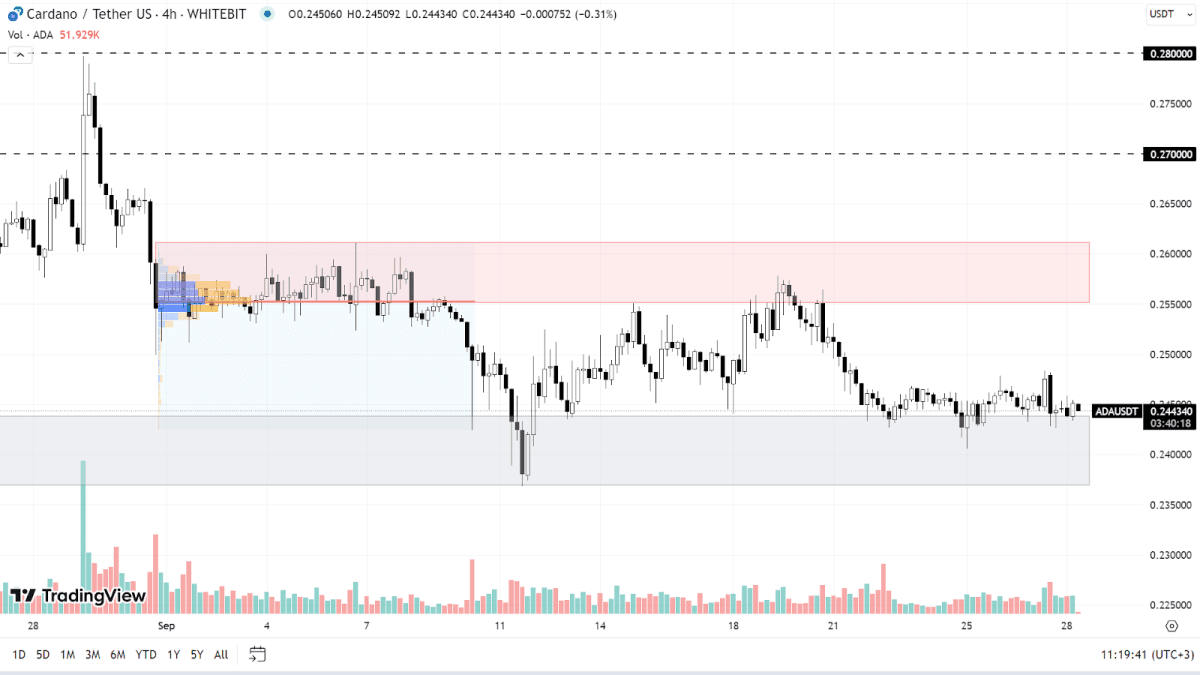
The ADA chart demonstrates a bearish trend, both locally and globally. The cryptocurrency is currently oscillating between the support zone of $0.237–$0.243 and the resistance zone of $0.255–$0.261. If BTC continues its correction, Cardano can reach a new local low and test the $0.220 mark.
To initiate an upward trajectory, buyers need to surpass the current resistance range. Beyond this range, dense clusters of seller orders are likely to be encountered at $0.270 and $0.280. The bearish trend will be considered nullified only when the cryptocurrency establishes itself above the $0.300 level.

ADA chart on the H4 timeframe
Dogecoin (DOGE)
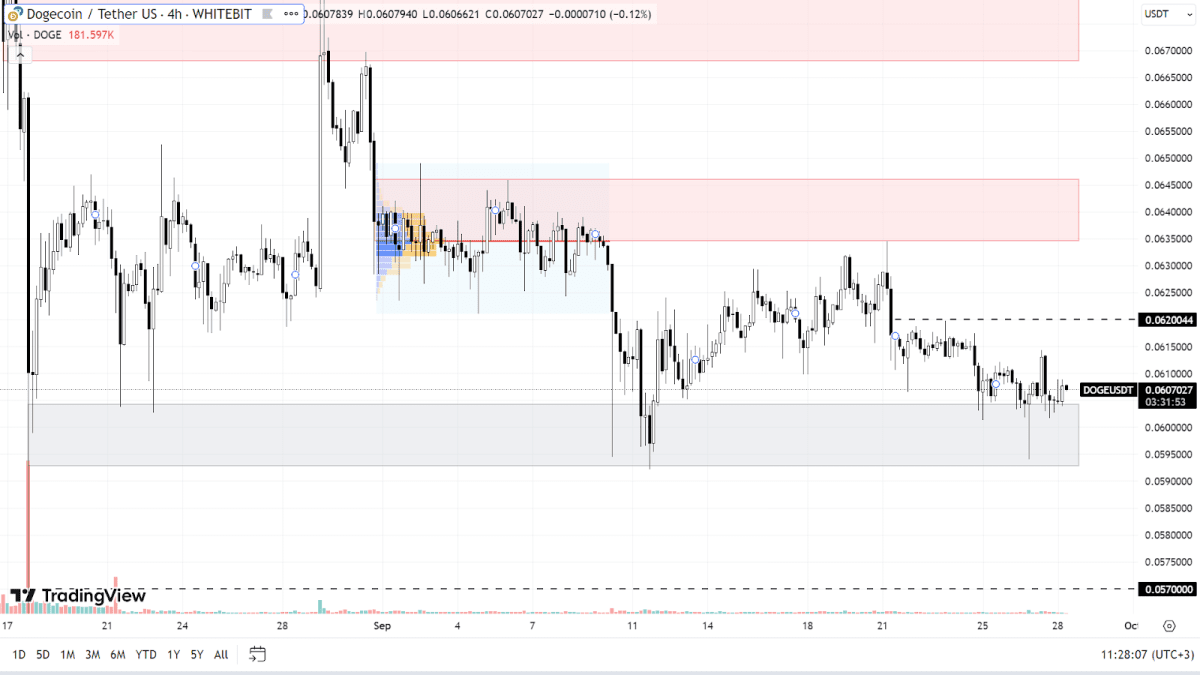
The correlation between DOGE and BTC is remarkably strong, Dogecoin is highly sensitive to fluctuations in Bitcoin's price. Currently, this asset is in a downward trend, trapped between a support zone of $0.059–$0.060 and a resistance zone of $0.0634–$0.0646. Within these ranges, there is an intermediary level at $0.062, populated with a significant amount of sell orders.
At present, a continued decline in the DOGE price is the prevailing expectation. Should the current support zone be breached, there could be a surge in buying activity around the $0.057 level.
To shift the local trend upwards, Dogecoin must break through the resistance zone at $0.0668–$0.0685 on significant volume and stabilize above the $0.072 level. Given its correlation with BTC, such a shift seems plausible only with a favorable news backdrop and a concurrent rise in Bitcoin.

DOGE chart on the H4 timeframe
Today, we anticipate important economic news releases, including the U.S. GDP for the second quarter, the number of initial jobless claims, and remarks from Fed Chairman Jerome Powell. The crypto market usually experiences increased volatility in response to such events, which traders should factor into their strategies.
Check out GNcrypto for the latest cryptocurrency rates and chart analysis.
Disclaimer
Please note that the analysis provided above should not be considered a trading recommendation. These are solely the opinions of the GNcrypto editorial board regarding the market situation. Before opening any deals, we strongly advise conducting your own research and analysis.
Abbreviations
TF (Timeframe) — a chronological period equal to the time it takes to form one Japanese candle on the chart.
Horizontal channel (flat, sideways, range) — the movement of price between support and resistance levels, without going beyond the given range.
К — simplified designation of one thousand dollars of the asset price (for example, 23.4K – $23,400).
Gray range on the chart — a support zone.
Red range on the chart — a resistance zone.
Correlation — the tendency of prices of different cryptocurrencies to move in sync, often influenced by the dominance of one of the assets.
Initial materials
This analysis was informed by the following educational materials and articles from GNcrypto:
Recommended

