DOGE and SHIB: Altcoin Analysis for December 5, 2023

Bitcoin continues its ascent, recently hitting a new yearly high at $42,384. Here's a look at the market situation for the alternative coins Dogecoin (DOGE) and Shiba Inu (SHIB) as of Tuesday, December 5.
Dogecoin (DOGE)
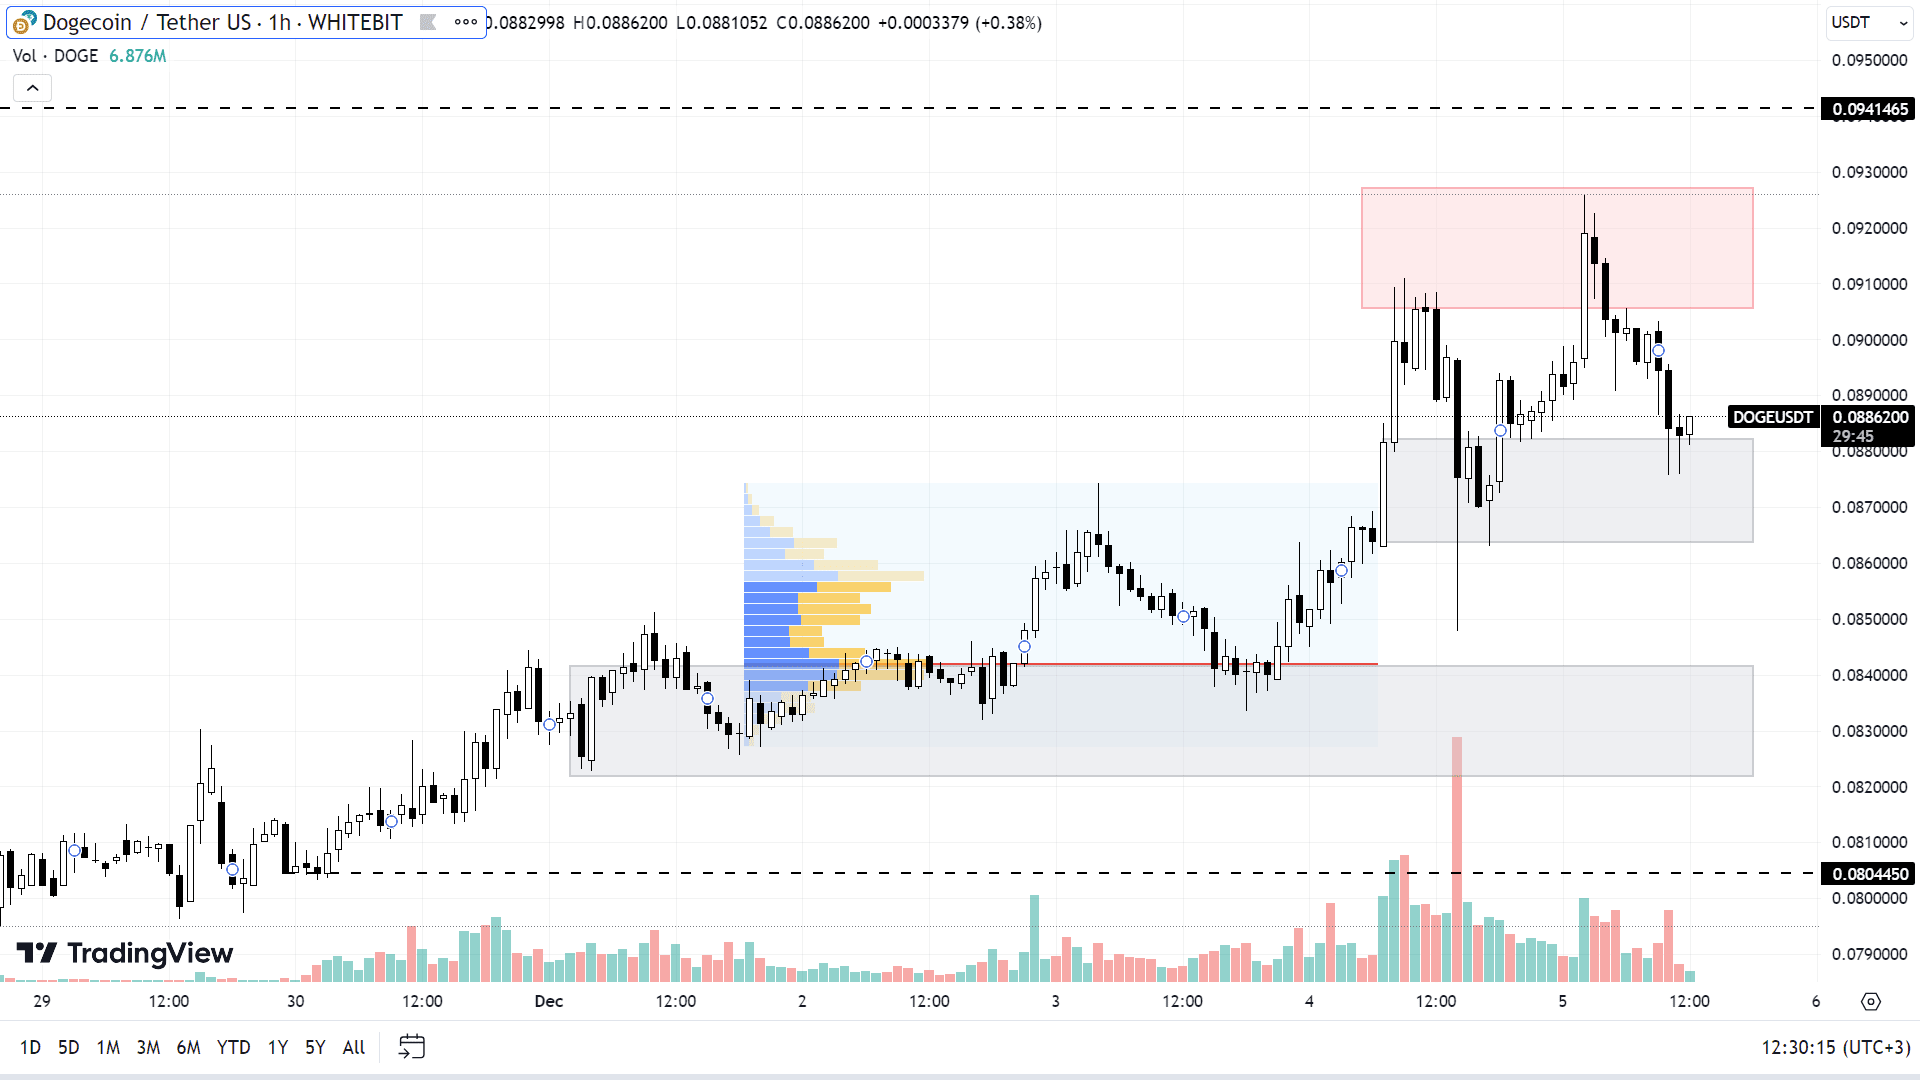
Dogecoin, maintaining a high correlation with Bitcoin, is also experiencing an upward trend. Since October 15, DOGE has increased by 70%, marking a new annual high at $0.0925.
With Bitcoin's ongoing positive trend, the growth of DOGE is also expected to continue. The next targets for buyers are set at $0.094, $0.097, and the significant $0.100 level. These targets may be tested as soon as the coming week.
If a market correction occurs, DOGE’s price could drop back to support areas around $0.086-$0.088, $0.0821-$0.0841, and $0.0800. However, if Bitcoin sharply falls below $39,000, DOGE might swiftly break through these support levels, suggesting that setting limit orders at this time might be risky.

DOGE chart on the H1 timeframe
Shiba Inu (SHIB)
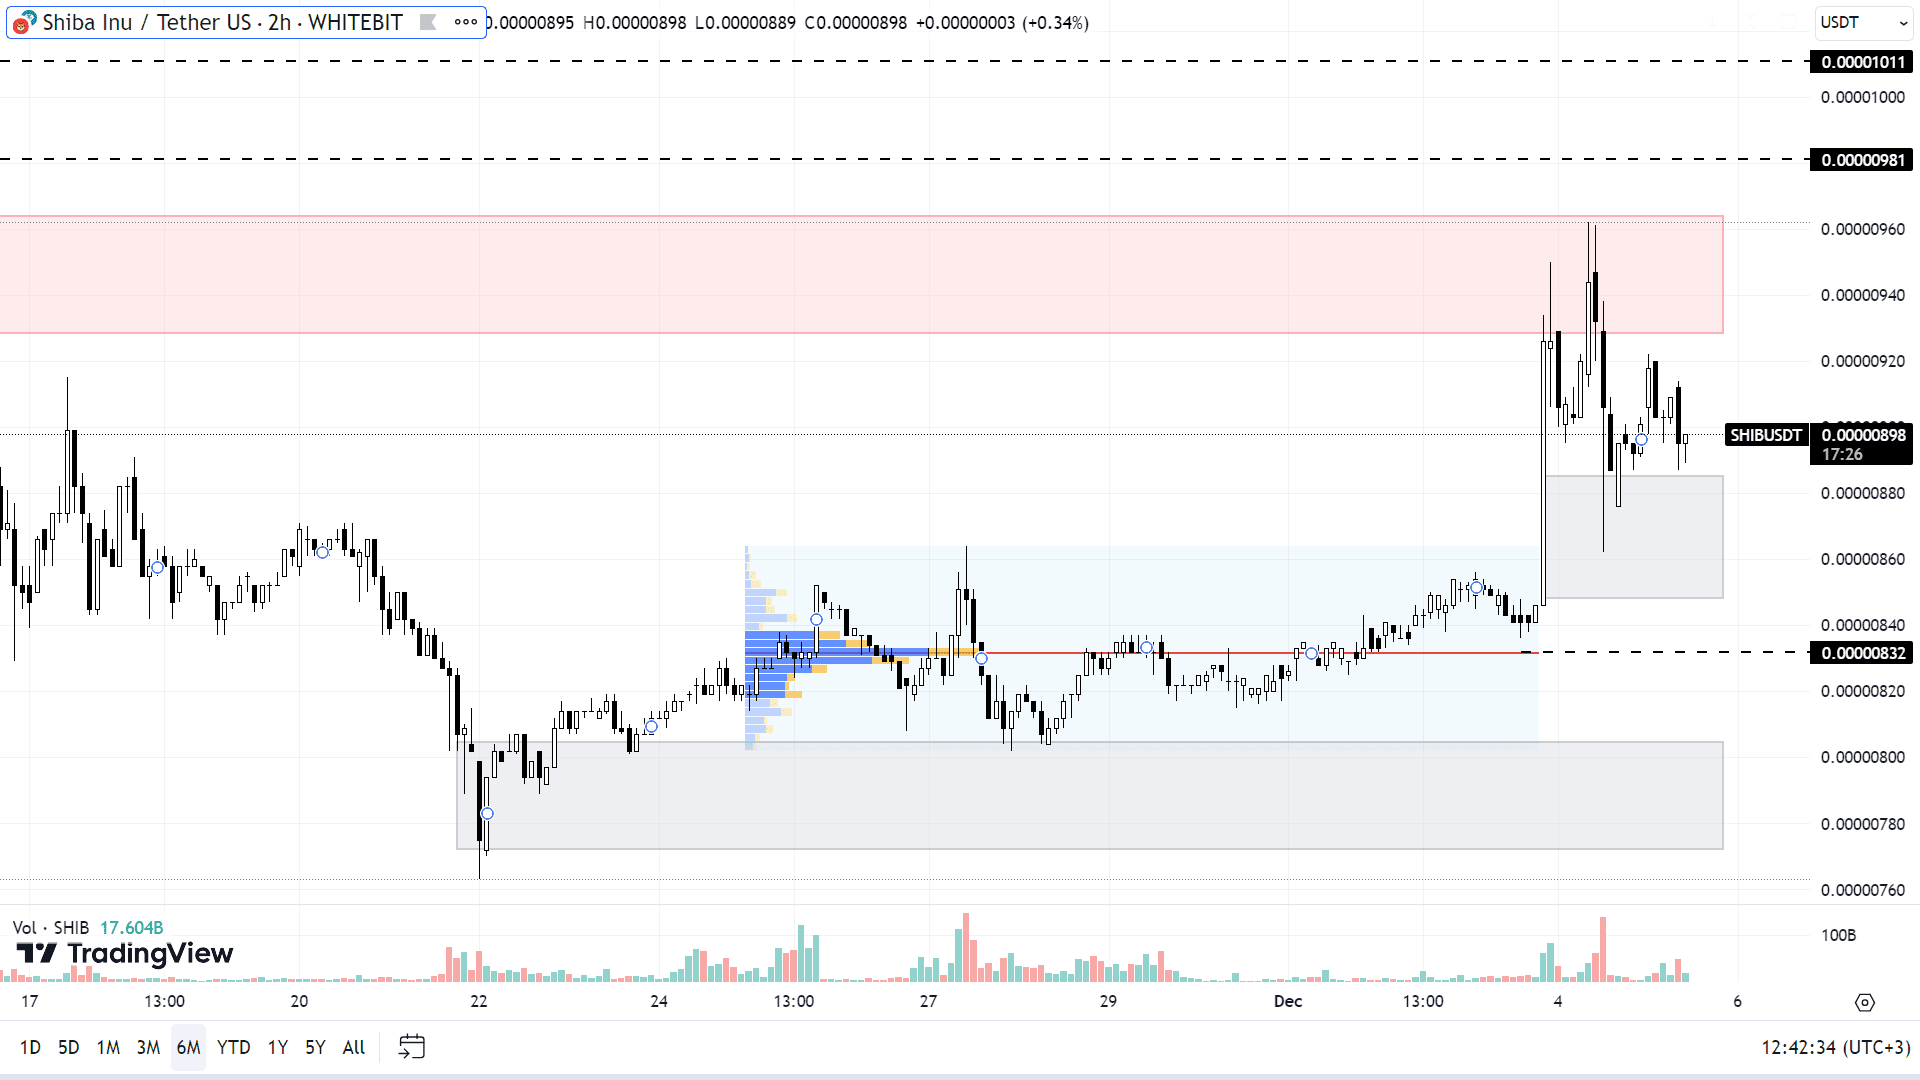
In comparison to other altcoins, SHIB has shown a less pronounced upward trend. Since October 15, the asset has gained 40%, but its chart is marked by frequent corrective movements, preventing SHIB from reaching new highs.
Currently, the asset is trading within a consolidation range, trapped between a support zone of $0.0000085-$0.0000088 and a resistance zone of $0.00000928-$0.00000964. Should the upward trend persist, SHIB could potentially reach local highs at $0.00000981 and even $0.00001. To attain its 2023 high, the asset needs to increase by an additional 75%, leaving room for considerable growth.
Any corrective patterns in BTC could similarly impact SHIB. In this case, the memecoin might drop below its present support zone, potentially testing levels of $0.00000830 and $0.00000772-$0.00000805. Similar to the situation with DOGE, using limit orders for SHIB currently poses a significant risk.

SHIB chart on the H2 timeframe
Check out GNcrypto for the latest cryptocurrency rates and chart analysis.
Disclaimer
Please note that the analysis provided above should not be considered a trading recommendation. Before opening any deals, we strongly advise conducting your own research and analysis.
Abbreviations
TF (Timeframe) — a chronological period equal to the time it takes to form one Japanese candle on the chart.
Horizontal channel (flat, sideways, range) — the price movement between support and resistance levels, without going beyond the given range.
К — simplified designation of one thousand dollars of the asset price (for example, 23.4K – $23,400).
Gray range on the chart — a support zone.
Red range on the chart — a resistance zone.
Correlation — the tendency of prices of different cryptocurrencies to move in sync, often influenced by the dominance of one of the assets.
Initial materials
This analysis was informed by the following educational materials and articles from GNcrypto:

