DYDX and FIL: Altcoin Analysis for October 25, 2023

Following a period of tumultuous growth, the BTC price has settled in the last 24 hours, making it an opportune moment to delve into other cryptocurrency charts. Here's a review of the market dynamics for the altcoins dYdX (DYDX) and Filecoin (FIL) as of Wednesday, October 25.
dYdX (DYDX)
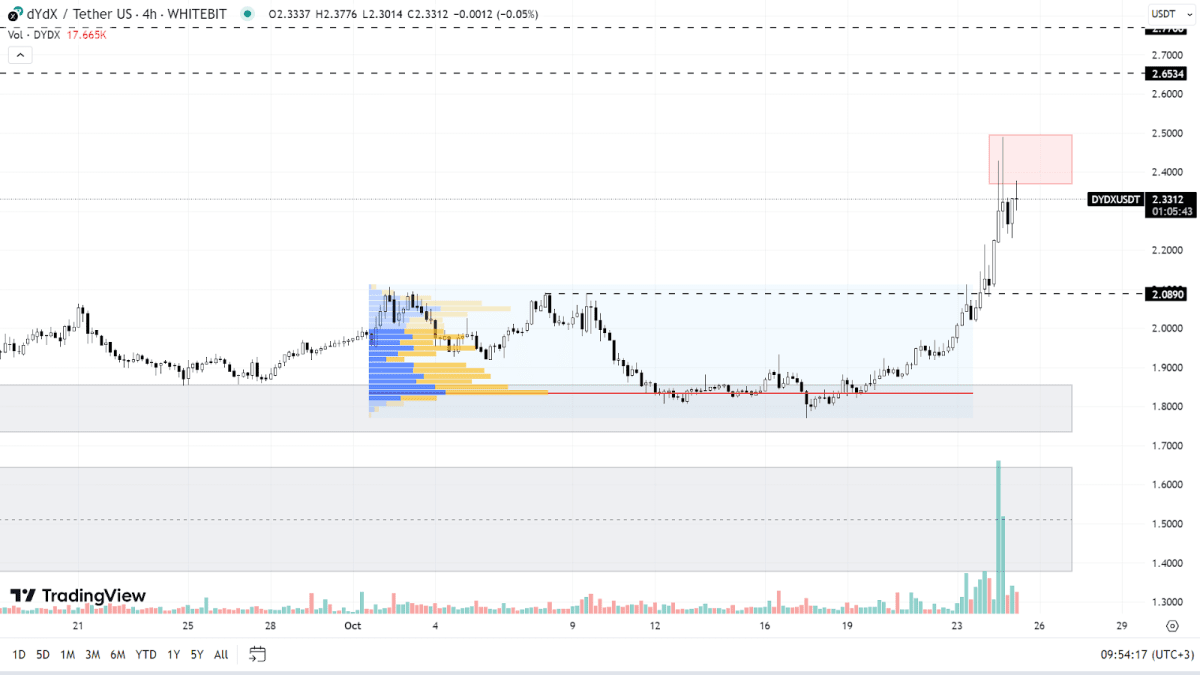
While the global trend for DYDX appears to be on a downtrend, there's been a positive shift in recent months. Since June, the asset has consistently traded above the $1.7 threshold, demonstrating resilience amidst Bitcoin's occasional downturns.
Currently, DYDX is benefiting from Bitcoin's upward trajectory. Over the past week, it surged by 25%, reaching the resistance zone between $2.37 and $2.50. The momentum suggests a continued rise, eyeing the next targets at $2.65 and $2.77.
Still, a slight correction within this upward trend wouldn't be unexpected. In such an event, DYDX might retreat to a support level of $2.09, or even revisit the buy range between $1.73 and $1.85. A descent into the $1.37-$1.64 range would indicate a shift from its recent bullish stance to a bearish one.
Also, it's crucial to consider certain fundamental developments that could impact the DYDX price. There's talk of the platform transitioning to its own blockchain by the end of the year, a move that could enhance its trajectory. However, whispers of a sizable token release for early investors in the upcoming months should also be weighed in when contemplating future trades.

DYDX chart on the H4 timeframe
Filecoin (FIL)
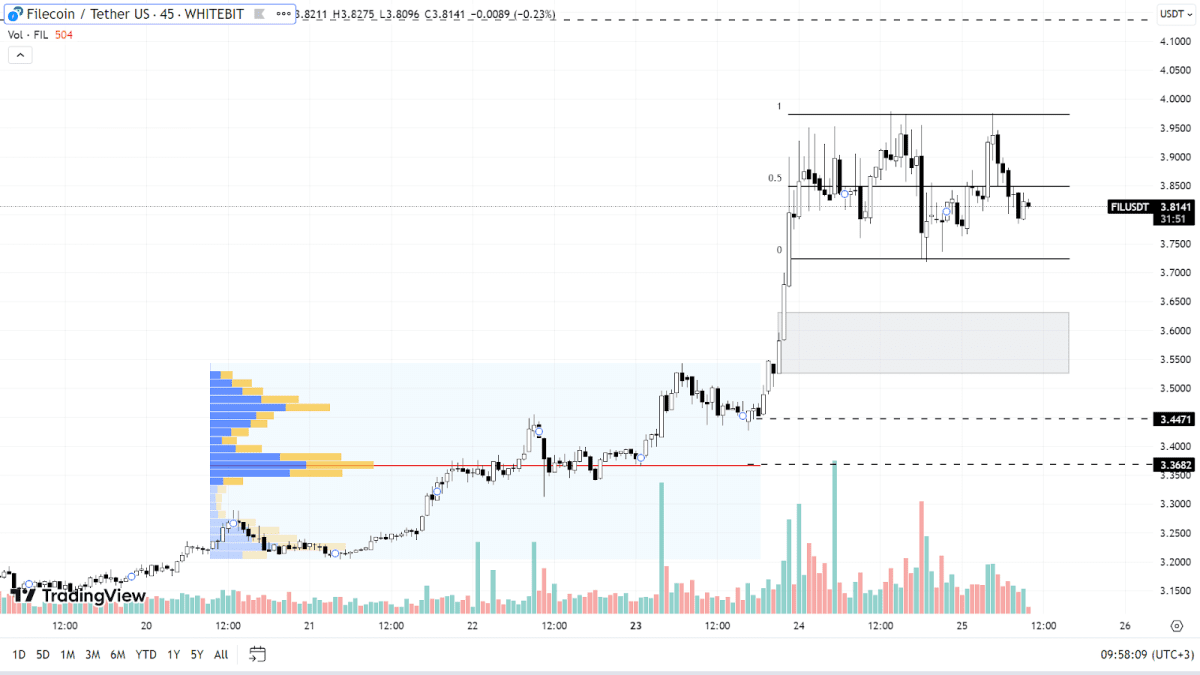
Similar to Bitcoin's trajectory, Filecoin has settled into a sideways movement after its sharp rise. Presently, the asset is navigating within a horizontal range, with support at $3.72 and resistance at $3.97. It's also important to consider the sellers' psychological barrier at $4.
The dominant projection is a continued rise. Beyond current resistance lies a target of $4.13, which may likely be the next high if the upward trend remains intact.
Should Bitcoin face a downturn, it might pull the FIL price toward the support area of $3.52-$3.63, and potentially to the levels of $3.44 and $3.36. As long as BTC maintains a position above $30,000, all altcoins, FIL included, appear set on updating their annual highs. On the Filecoin chart, this peak represents a 280% increase from its present price.

FIL chart on the M45 timeframe
Today, market participants are bracing for updates on various economic indicators: the number of issued building permits, new home sales, U.S. crude oil inventories, and remarks from Fed Chair Jerome Powell. These data points might induce heightened volatility in both traditional financial markets and the crypto sphere.
Check out GNcrypto for the latest cryptocurrency rates and chart analysis.
Disclaimer
Please note that the analysis provided above should not be considered a trading recommendation. Before opening any deals, we strongly advise conducting your own research and analysis.
Abbreviations
TF (Timeframe) — a chronological period equal to the time it takes to form one Japanese candle on the chart.
Horizontal channel (flat, sideways, range) — the price movement between support and resistance levels, without going beyond the given range.
К — simplified designation of one thousand dollars of the asset price (for example, 23.4K – $23,400).
Gray range on the chart — a support zone.
Red range on the chart — a resistance zone.
Correlation — the tendency of prices of different cryptocurrencies to move in sync, often influenced by the dominance of one of the assets.
Initial materials
This analysis was informed by the following educational materials and articles from GNcrypto:
Recommended

