Exploring ADA and TRX: Altcoin Analysis for August 10, 2023

As Bitcoin's chart remains consistent from our previous analysis, we shift our focus towards the market dynamics of Cardano (ADA) and Tron (TRX).
Cardano (ADA)
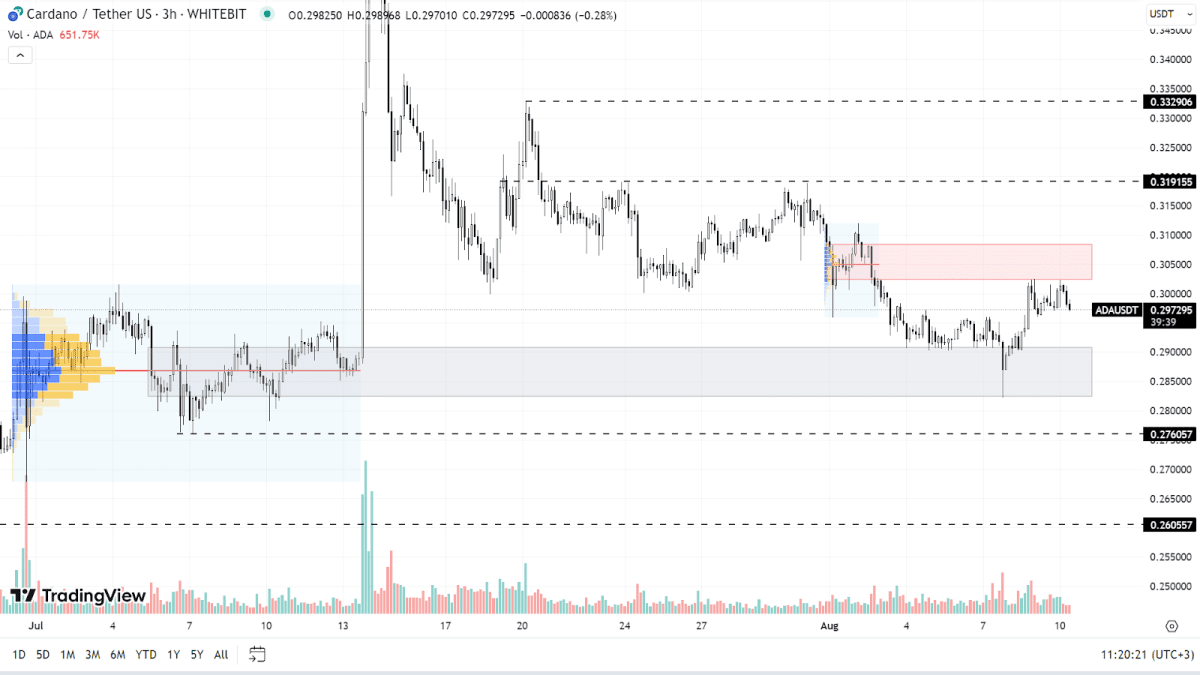
On August 7, ADA hit a local low at $0.282. Currently, the overall trend for Cardano is bearish, suggesting the likelihood of further declines. It would be reasonable to expect another test of the support zone between $0.282 and $0.290. If this range is breached, ADA could drop toward the next support level at $0.276.
For a shift to a bullish trajectory, buyers must decisively push through the resistance spanning $0.302 to $0.308 and firmly anchor above the $0.319 level, where a dense batch of seller orders resides. Achieving this could set the stage for new local highs and continued ascent. Broadly speaking, ADA's trajectory is closely tied to BTC's movements. However, ADA tends to be more sensitive to Bitcoin's declines than its rallies.

ADA chart on the H3 timeframe
Tron (TRX)
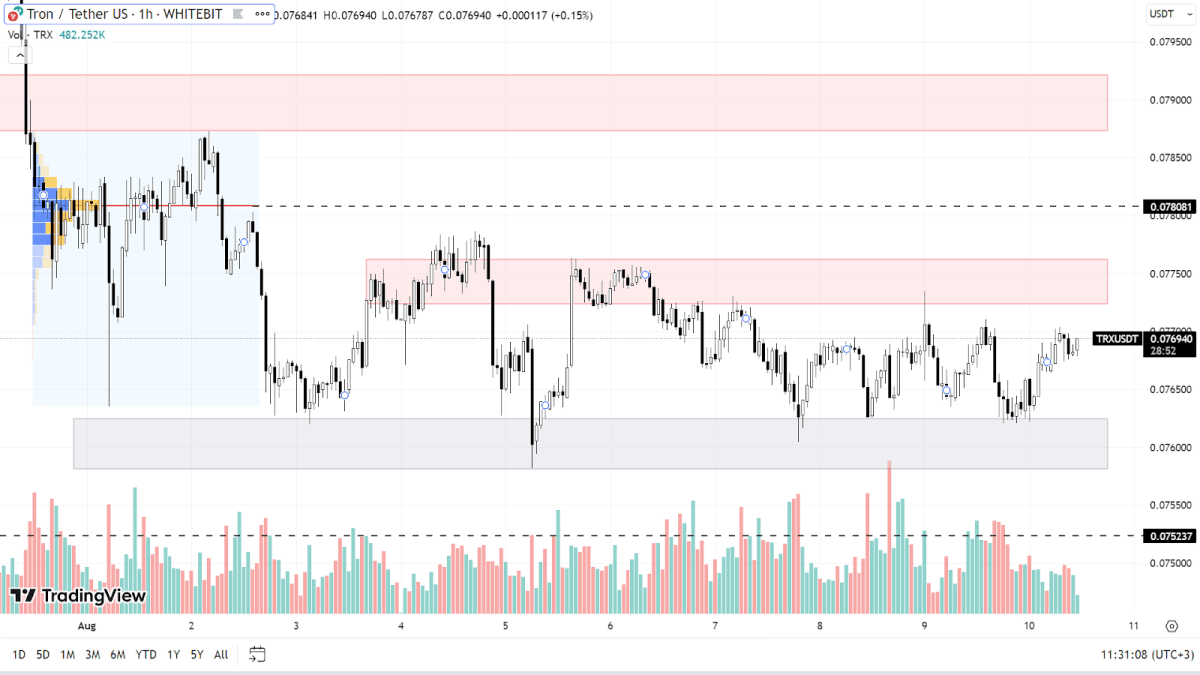
Since the beginning of August, TRX has been trading sideways, fluctuating between support levels of $0.0758-$0.0762 and resistance zones of $0.0772-$0.0776. If the downtrend persists, TRX might reach a new low around the $0.0752 point.
For a positive shift in momentum, Tron needs to breach the $0.078 mark, establishing itself above the resistance range of $0.0787-$0.0792. Accomplishing this would indicate a potential end to its recent downtrend.
The close ties between the Tron Foundation's leadership and Huobi mean that recent concerns about Huobi's financial solvency have had a ripple effect on the TRX price. This connection is expected to persist, suggesting that when assessing TRX, both technical analysis and broader market conditions should be taken into account.

TRX chart on the H1 timeframe
Today, the latest US inflation data will be released. Economic news of this magnitude can significantly influence the crypto market, making it more volatile. Given this, it might be wise for traders to either refrain from active trading or mitigate potential trading risks.
Check out GNcrypto for the latest cryptocurrency rates and chart analysis.
Disclaimer
Please note that the analysis provided above should not be considered a trading recommendation. These are solely the opinions of the GNcrypto editorial board regarding the market situation. Before opening any deals, we strongly advise conducting your own research and analysis.
Abbreviations
TF (Timeframe) — a chronological period equal to the time it takes to form one Japanese candle on the chart.
Horizontal channel (flat, sideways, range) — the movement of price between support and resistance levels, without going beyond the given range.
К — simplified designation of one thousand dollars of the asset price (for example, 23.4K - $23,400).
Gray range on the chart — a support zone.
Red range on the chart — a resistance zone.
Correlation — the tendency of prices of different cryptocurrencies to move in sync, often influenced by the dominance of one of the assets.
Initial materials
This analysis was informed by the following educational materials and articles from GNcrypto:
Recommended

