FXS and CHZ: Altcoin Analysis for December 6, 2023

Bitcoin continues its upward trend, having recently hit a new yearly high of $44,462. Here's an analysis of the market situation for altcoins Frax Share (FXS) and Chiliz (CHZ) as of Wednesday, December 6.
Frax Share (FXS)
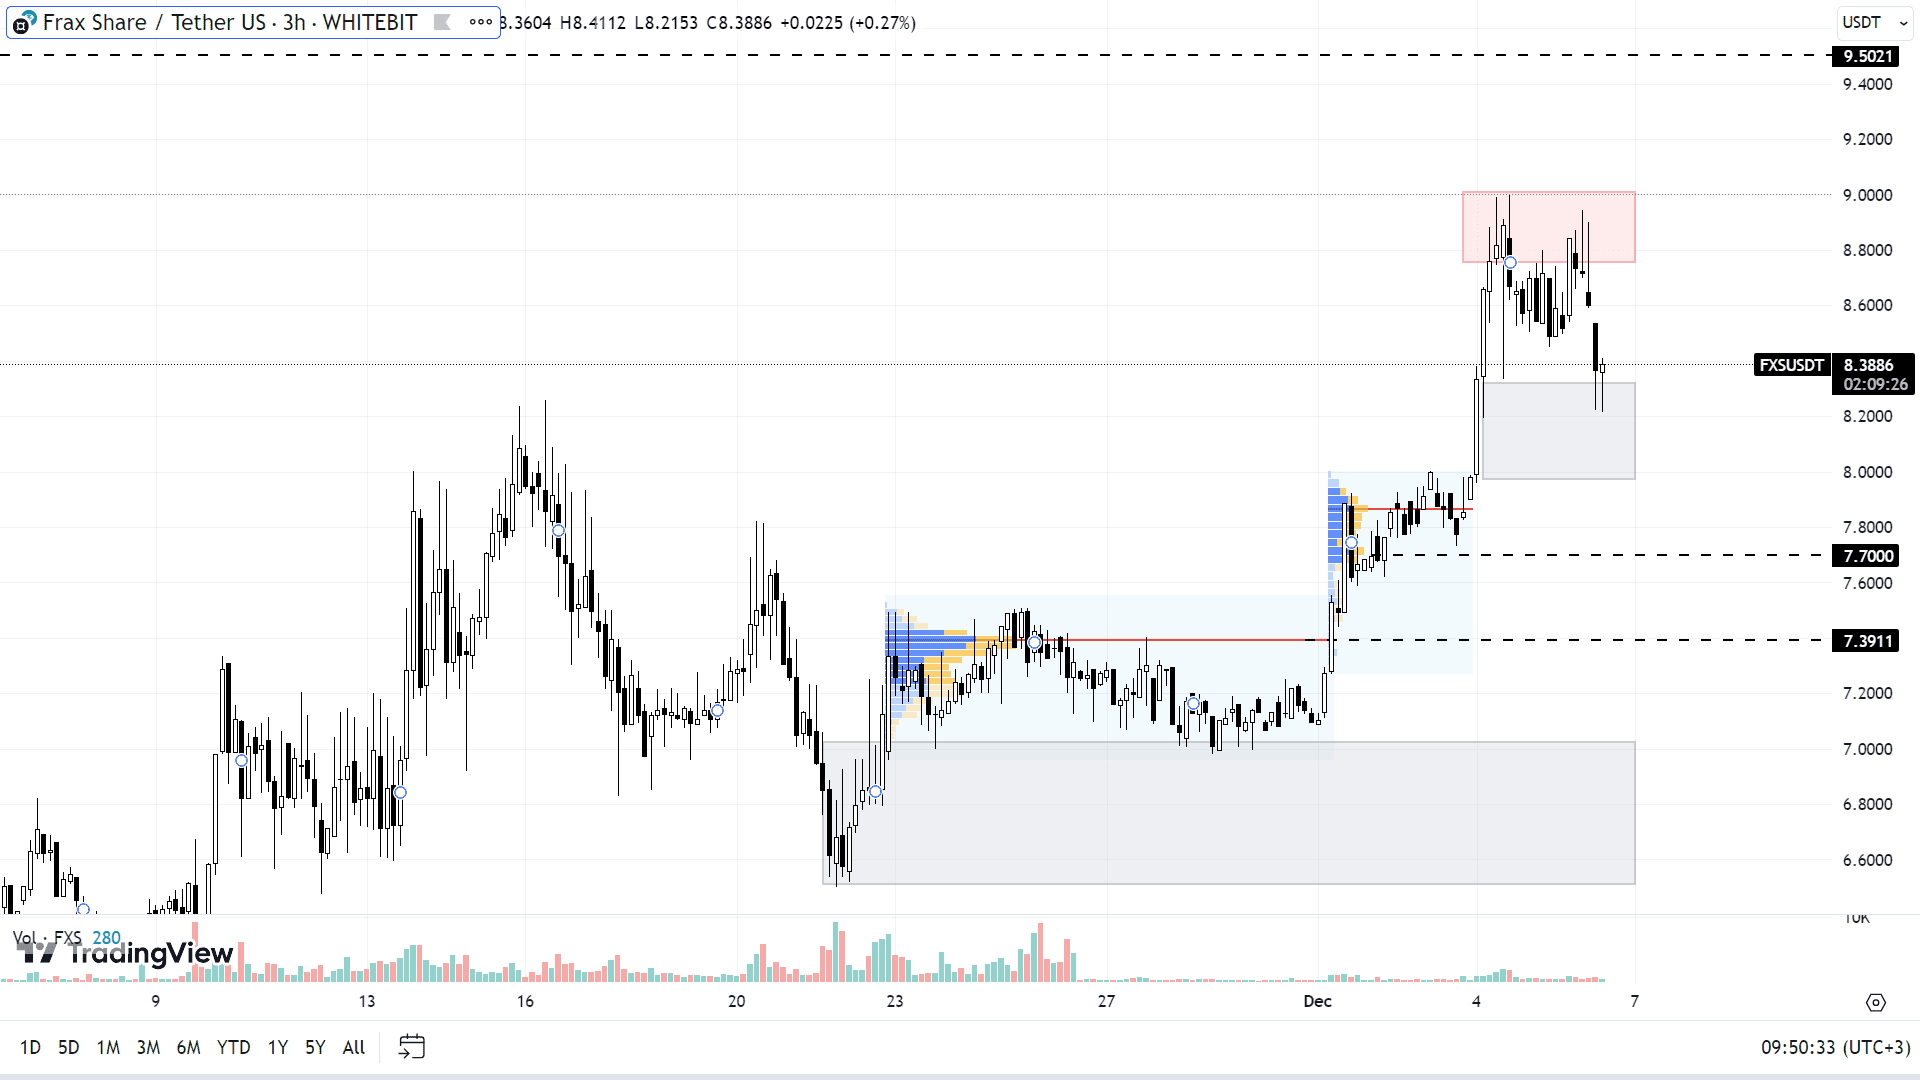
The FXS token has been mirroring the rise of BTC. Just two days ago, FXS reached a new high at $9, marking a significant increase of 70% since October 15.
Currently, the FXS price is fluctuating between the support zone of $7.97-$8.32 and the resistance zone of $8.75-$9.00. If Bitcoin’s upward trend persists, it is likely to have a favorable impact on FXS and other altcoins. Therefore, the primary scenario for FXS is to reach a new local high, with the first target for buyers at $9.5. Breaking the psychological threshold of $10 could further accelerate the price growth of the asset.
In case of a correction, FXS could revisit the support levels of $7.7 and $7.4 and could even drop to the buyer range of $6.51-$7.02. Should Bitcoin undergo a deeper correction, Frax Share could completely reverse its gains from October to December. Hence, placing limit orders on FXS might be risky under current market conditions.

FXS chart on the H3 timeframe
Chili (CHZ)
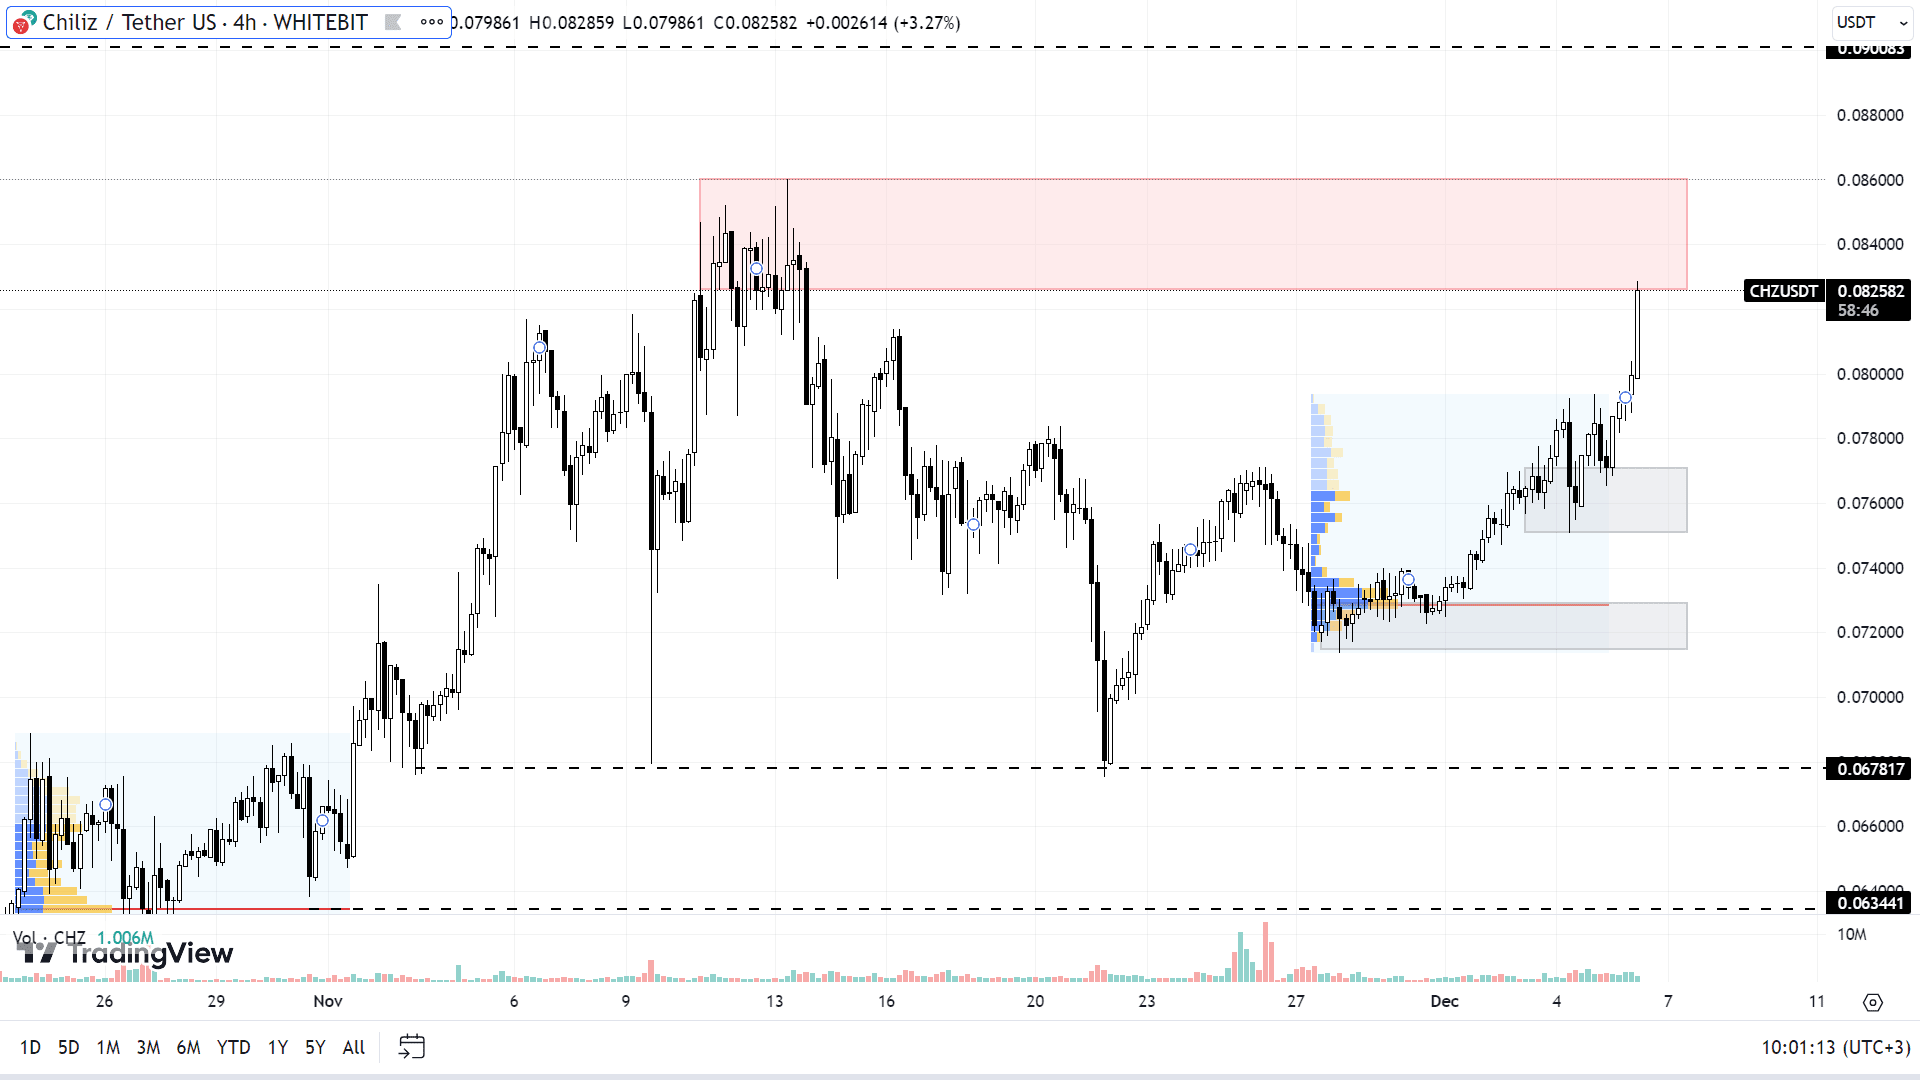
Since mid-October 2023, CHZ has registered a growth of 52%, yet it still has to climb an additional 110% to reach its annual high. This gap indicates room for further growth of the token. Currently, CHZ is nearing a resistance zone at $0.082-$0.086, which is the key hurdle before it can set new local highs.
For CHZ buyers, the forthcoming resistance levels to watch are $0.090 and $0.095. Chiliz's growth rate might increase after the price securely surpasses the $0.1 level, as there are no significant barriers beyond this point, given the asset's price hasn't been this high for a long time.
If CHZ undergoes a correction, its price could test the support zones at $0.075-$0.077, $0.0715-$0.073, $0.067, and $0.063. However, a potential decline in CHZ could be linked to a downturn in Bitcoin. Thus, due to the strong correlation between CHZ and BTC, it's recommended to first examine the Bitcoin chart before making any decisions.

CHZ chart on the H4 timeframe
Check out GNcrypto for the latest cryptocurrency rates and chart analysis.
Disclaimer
Please note that the analysis provided above should not be considered a trading recommendation. Before opening any deals, we strongly advise conducting your own research and analysis.
Abbreviations
TF (Timeframe) — a chronological period equal to the time it takes to form one Japanese candle on the chart.
Horizontal channel (flat, sideways, range) — the price movement between support and resistance levels, without going beyond the given range.
К — simplified designation of one thousand dollars of the asset price (for example, 23.4K – $23,400).
Gray range on the chart — a support zone.
Red range on the chart — a resistance zone.
Correlation — the tendency of prices of different cryptocurrencies to move in sync, often influenced by the dominance of one of the assets.
Initial materials
This analysis was informed by the following educational materials and articles from GNcrypto:

