ICP and NEAR Altcoin Analysis for November 24, 2023

Bitcoin continues to trade above the $37,000 threshold, and since our previous analysis, there have been no major changes in its chart. Here's a review of the market situation for Internet Computer (ICP) and Near Protocol (NEAR) as of Friday, November 24.
Internet Computer (ICP)
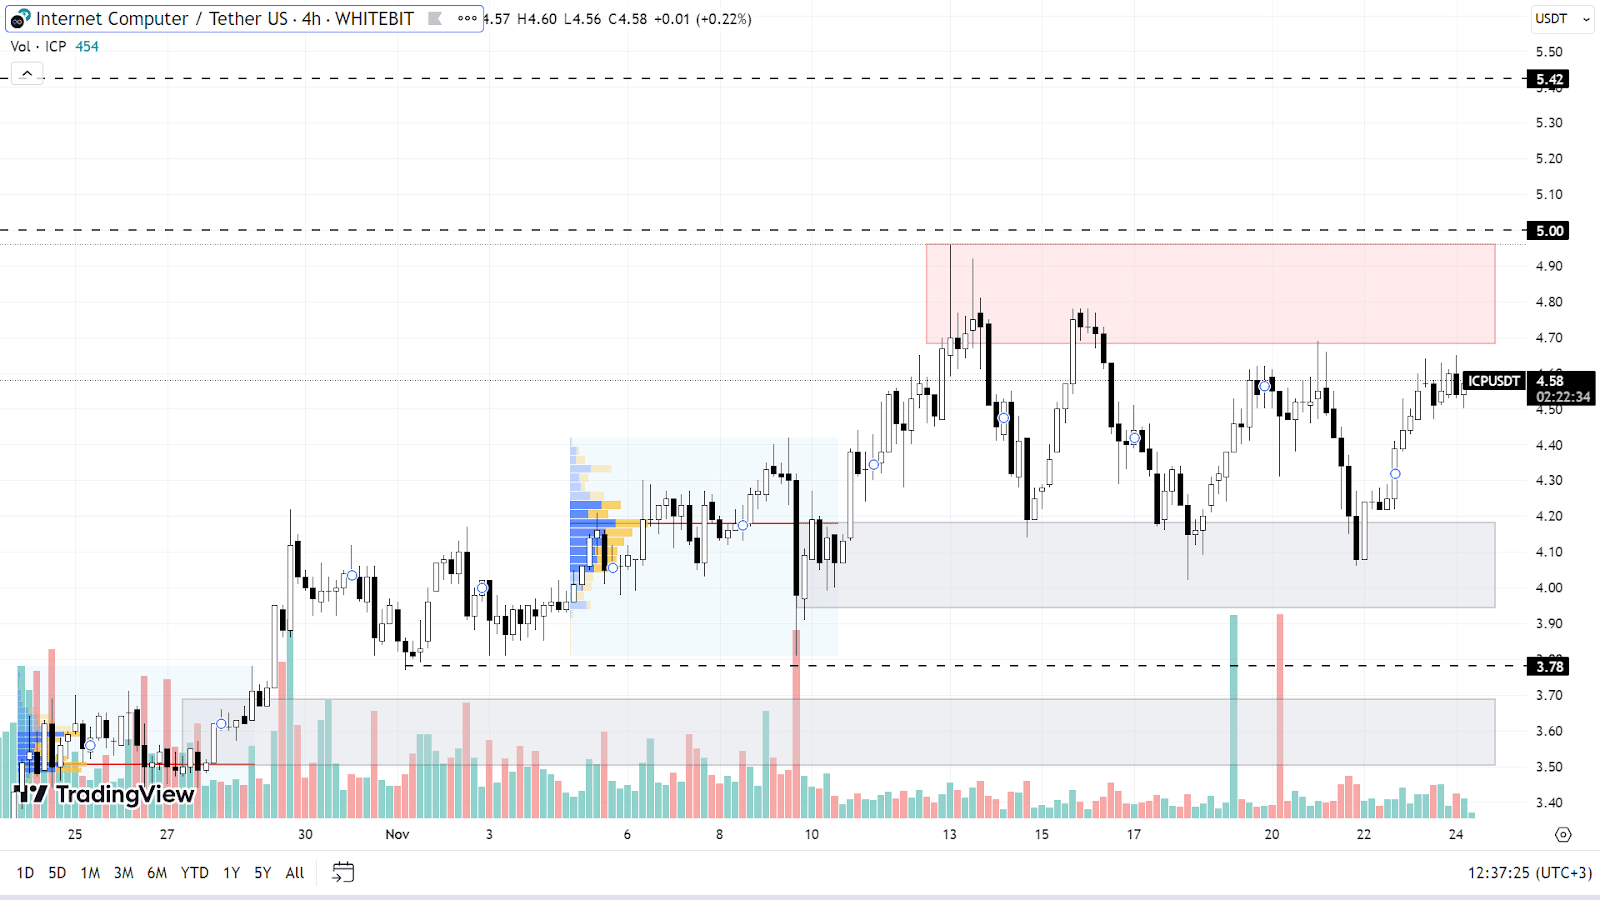
Contrary to other altcoins, ICP has shown a relatively muted response to the BTC rise. Although the asset has appreciated by 70% since October 15, it has not yet reached a new annual high, and the ICP growth rate remains somewhat sluggish.
Currently, the asset is trading between a support zone of $3.94-$4.18 and a resistance level of $4.64-$4.96. If BTC continues its sideways trend above $37,000 or maintains its upward movement, ICP might follow a similar trajectory. The next target for buyers could be the psychological level of $5, with an additional notable level at $5.42 just above.
In the event of a correction, ICP could retest its current buyer's zone, as well as potentially drop to the level of $3.78 and into the range of $3.5-$3.7.

ICP chart on the H4 timeframe
Near Protocol (NEAR)
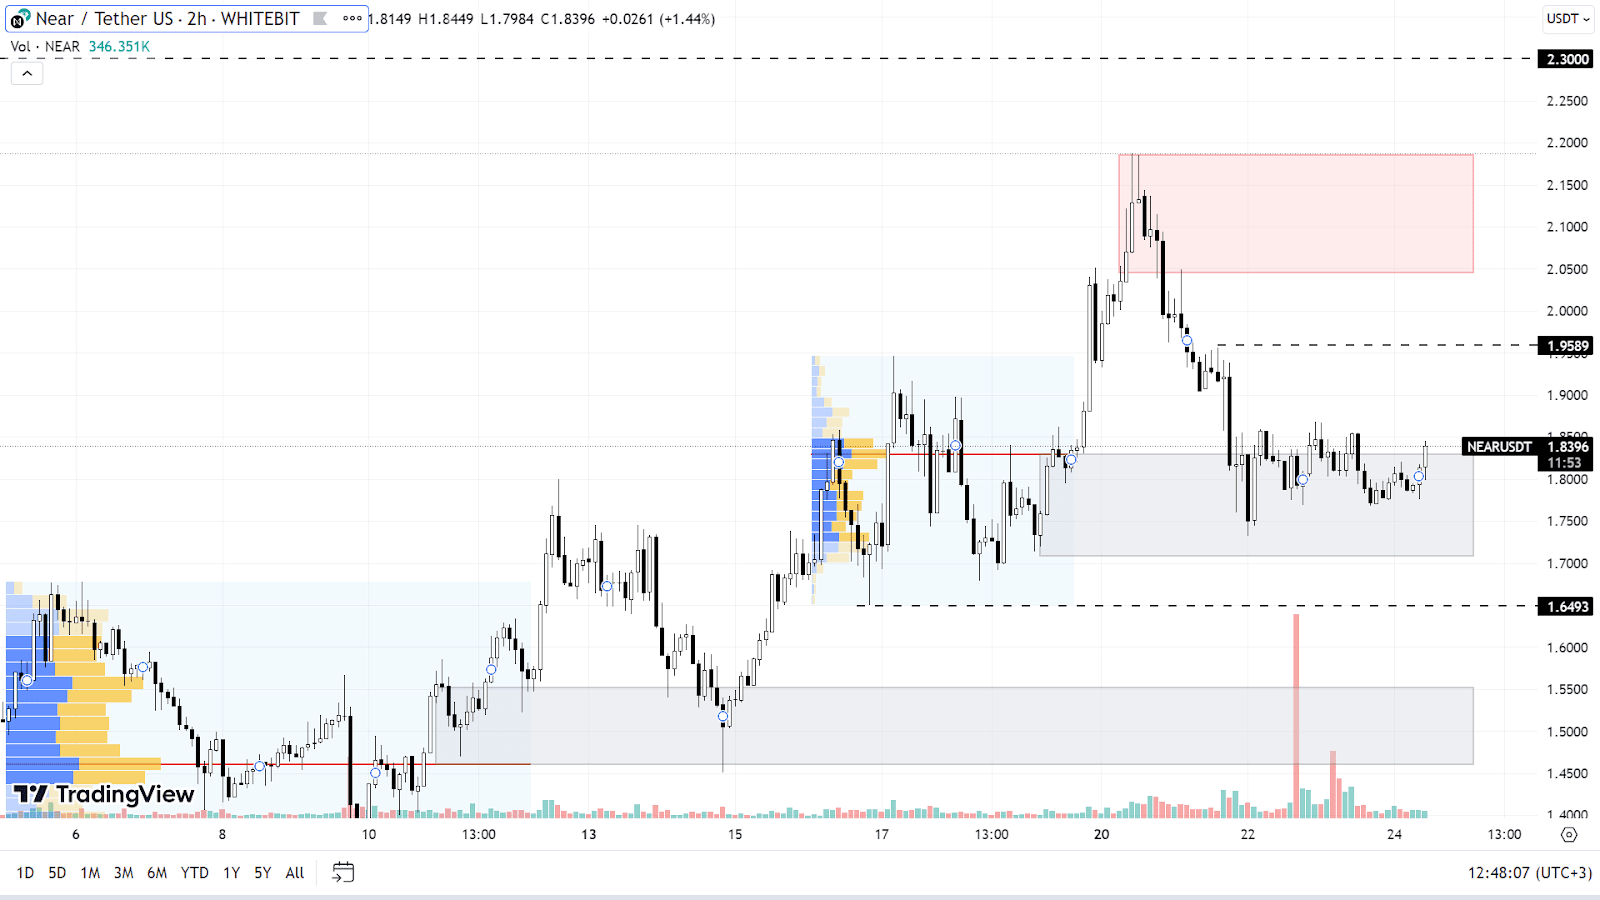
While NEAR's price has surged by 120% over the past month, its growth has recently decelerated. The asset is trading in a support zone ranging from $1.70 to $1.83, and buyers appear hesitant to push the asset beyond this range.
Should NEAR continue its upward trajectory amid Bitcoin's positive trend, the token might test the $1.95 mark and encounter resistance in the $2.05-$2.19 zone. Bulls are prioritizing breaking past these local highs. If successful, NEAR might then tackle resistance levels at $2.3 and $2.4.
Beneath its current support zone, NEAR has a potential buyer's level at $1.65 and another zone between $1.46 and $1.55. These levels could be tested even without a Bitcoin market correction, particularly if buyers lack the momentum to drive up prices from their current positions.

NEAR chart on the H2 timeframe
Cryptocurrency markets typically experience quieter weekends with less chart volatility, a pattern likely to continue in this instance.
Check out GNcrypto for the latest cryptocurrency rates and chart analysis.
Disclaimer
Please note that the analysis provided above should not be considered a trading recommendation. Before opening any deals, we strongly advise conducting your own research and analysis.
Abbreviations
TF (Timeframe) — a chronological period equal to the time it takes to form one Japanese candle on the chart.
Horizontal channel (flat, sideways, range) — the price movement between support and resistance levels, without going beyond the given range.
К — simplified designation of one thousand dollars of the asset price (for example, 23.4K – $23,400).
Gray range on the chart — a support zone.
Red range on the chart — a resistance zone.
Correlation — the tendency of prices of different cryptocurrencies to move in sync, often influenced by the dominance of one of the assets.
Initial materials
This analysis was informed by the following educational materials and articles from GNcrypto:
Recommended

