LINK and TRX: Altcoin Analysis for December 1, 2023

Bitcoin is sustaining its upward trajectory, providing a favorable climate for altcoins to continue hitting new highs. Here's an update on the market situation for alternative coins Chainlink (LINK) and Tron (TRX) as of Friday, December 1.
Chainlink (LINK)
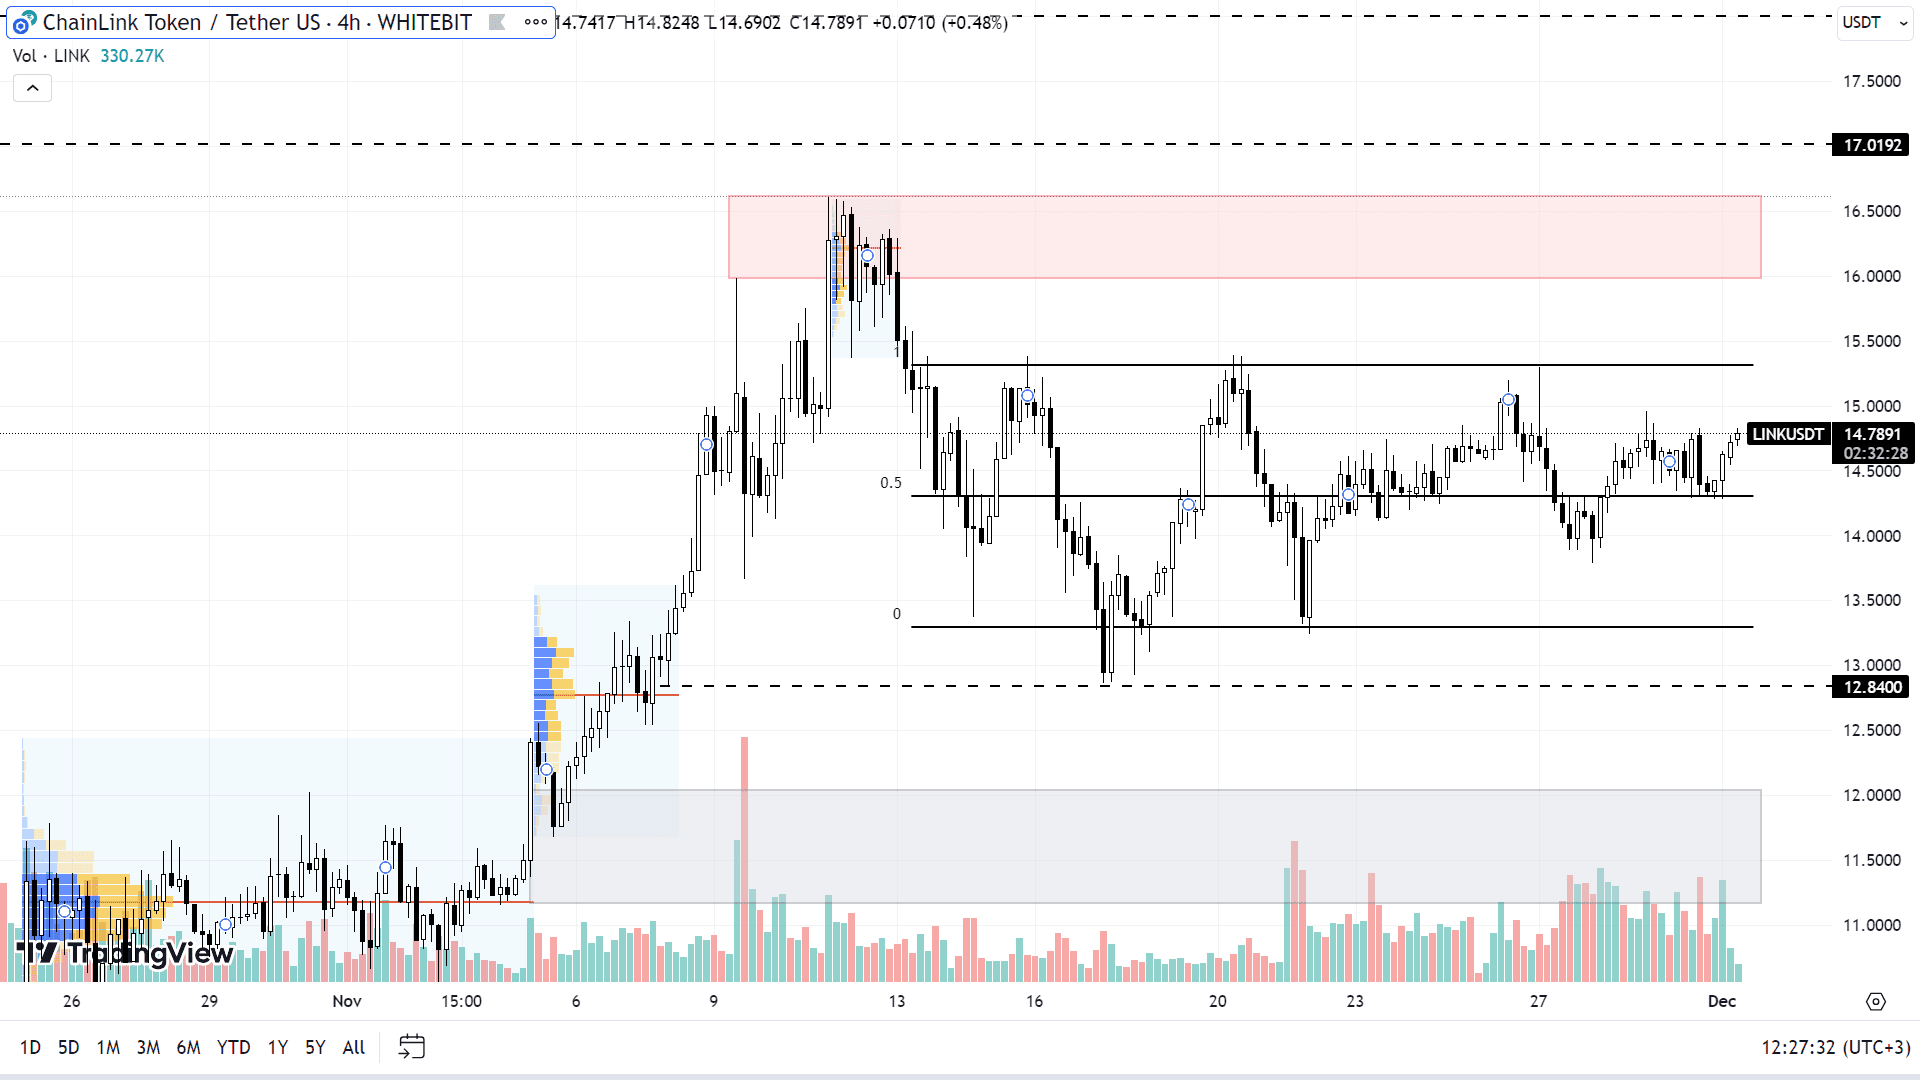
Despite LINK's strong performance in recent months, the asset has been trading sideways for about three weeks. It fluctuates between local support at $13.3 and a resistance level at $15.3.
For a revival in trading activity, LINK needs to decisively break through one of these levels and establish a new threshold. Should the upward movement persist, LINK might approach the resistance area around $16.00-$16.61, with prospects of pushing towards $17 and $18.
On the flip side, if LINK descends and stabilizes below the $13.3 mark, the asset could drop to about $12.84 and even reach the support zone of $11.16-$12.05, where a substantial amount of buyer orders are situated.

LINK chart on the H4 timeframe
Tron (TRX)
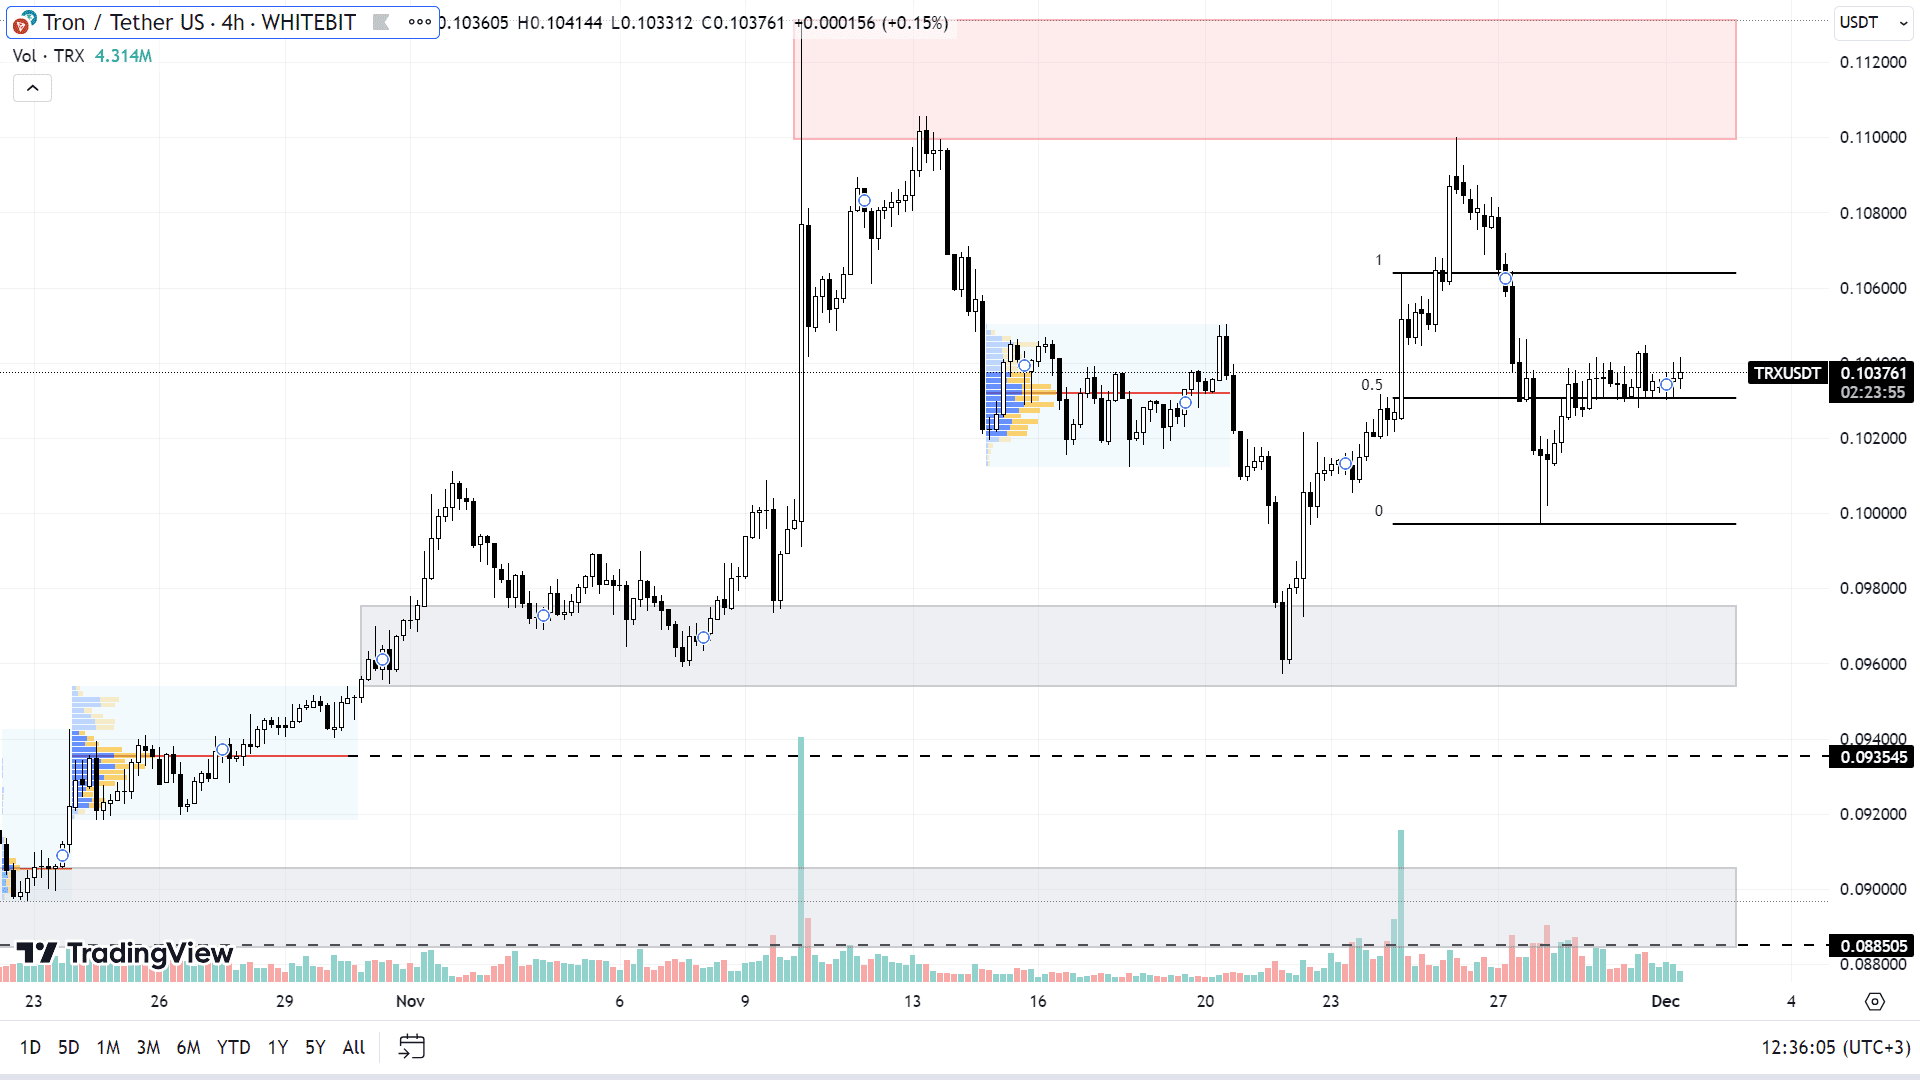
TRX buyers have been quite active, causing the cryptocurrency to test the resistance zone of $0.110-$0.113 on three occasions since November 8, as it tries to break through this range and set a new yearly high.
Currently, there's a noticeable reduction in TRX's volatility, making it likely to see short-term trading within a flat range, specifically between support levels of $0.100 and $0.106. The potential for the TRX growth still exists as long as BTC remains trading above the $31,000 threshold.
A correction in TRX's trajectory is not expected to lead to significantly negative outcomes. If there is a decline, Tron might retest the support levels at $0.095-$0.097, $0.0935, and $0.0885-$0.0905. Given its robust upward trend, TRX is viewed as a viable addition to portfolios, particularly during periods of BTC correction.

TRX chart on the H4 timeframe
Cryptocurrency markets usually experience reduced trading activity and volatility over weekends. BTC will probably maintain trading within the previously analyzed support and resistance zones.
Check out GNcrypto for the latest cryptocurrency rates and chart analysis.
Disclaimer
Please note that the analysis provided above should not be considered a trading recommendation. Before opening any deals, we strongly advise conducting your own research and analysis.
Abbreviations
TF (Timeframe) — a chronological period equal to the time it takes to form one Japanese candle on the chart.
Horizontal channel (flat, sideways, range) — the price movement between support and resistance levels, without going beyond the given range.
К — simplified designation of one thousand dollars of the asset price (for example, 23.4K – $23,400).
Gray range on the chart — a support zone.
Red range on the chart — a resistance zone.
Correlation — the tendency of prices of different cryptocurrencies to move in sync, often influenced by the dominance of one of the assets.
Initial materials
This analysis was informed by the following educational materials and articles from GNcrypto:

