LINK and UNI Altcoin Analysis for November 3, 2023

Bitcoin continues to trade sideways between a support level of $33,300 and a resistance point of $35,400, showing no significant changes on the chart. Here’s an overview of the market situation for Chainlink (LINK) and Uniswap (UNI) as of Friday, November 3.
Chainlink (LINK)
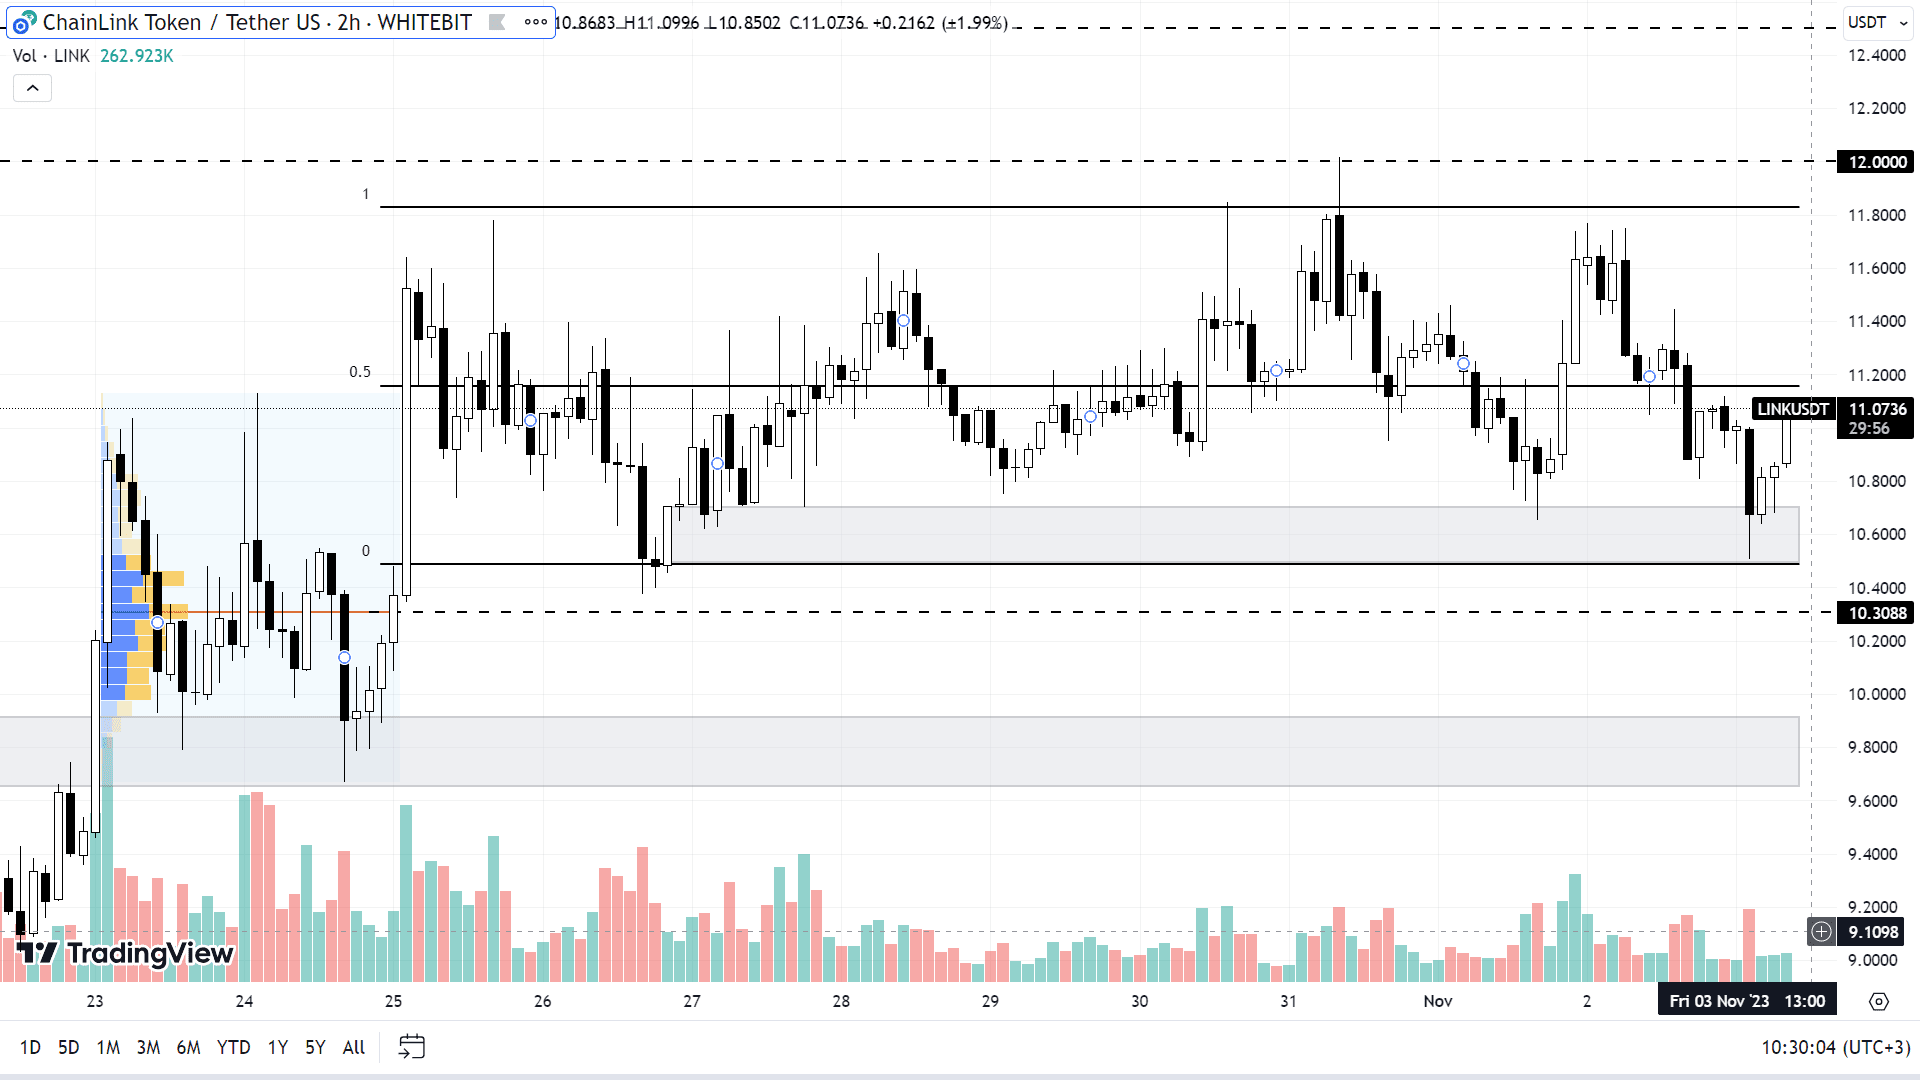
Over the last two months, LINK has exhibited phenomenal growth. Since September 10, the asset has doubled in value, reaching a yearly high at the $11.8 mark.
Currently, LINK is trading within a wide sideways channel, supported at $10.5 and capped by resistance at $11.8. The asset's priority remains to maintain its positive trajectory and to progressively scale new heights. Since the token hasn't reached these levels in the last eighteen months, strong resistance levels will be established as it approaches them in real-time.
For buyers, the immediate targets could be the psychological threshold of $12 and then the $12.5 mark.
In the event of a downturn or correction, LINK could test support levels at $10.50-$10.70, $10.30, and $9.65-$9.90.

LINK chart on the H2 timeframe
Uniswap (UNI)
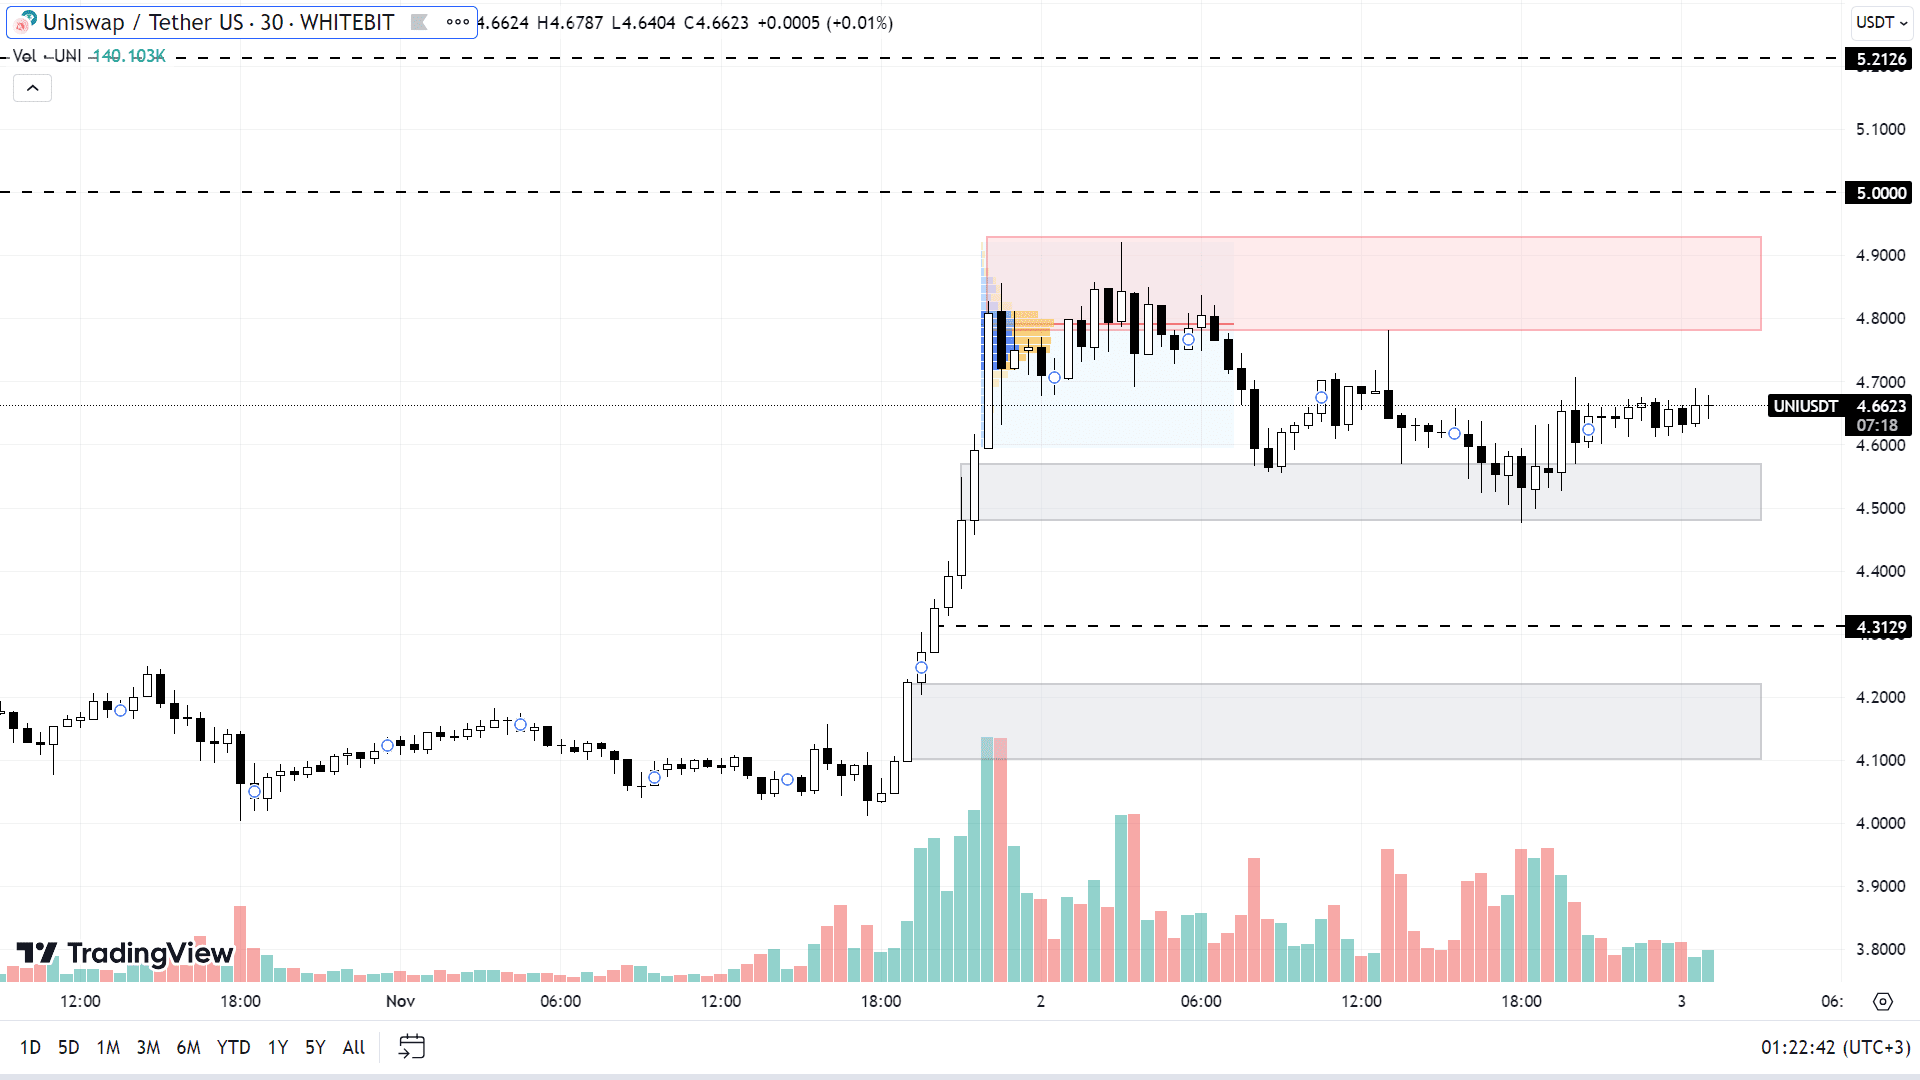
Despite Uniswap (UNI) exhibiting a rather muted response to Bitcoin's October gains, it has seen a significant uptick in the last few days, surging 20% and setting a new local high at $4.92.
UNI is currently fluctuating between the support level of $4.48-$4.57 and a resistance corridor of $4.78-$4.92. If this positive trend continues, echoing Bitcoin's chart movements, Uniswap's token is likely to maintain its ascent.
The next targets for buyers are the psychological level of $5 and the $5.2 mark. In case of a correction, UNI could test the support levels at $4.31 and between $4.10-$4.22 without disrupting the prevailing uptrend.

UNI chart on the M30 timeframe
On weekends, the crypto market typically experiences reduced volatility, a trend that may continue this weekend as well.Check out GNcrypto for the latest cryptocurrency rates and chart analysis.
Disclaimer
Please note that the analysis provided above should not be considered a trading recommendation. Before opening any deals, we strongly advise conducting your own research and analysis.
Abbreviations
TF (Timeframe) — a chronological period equal to the time it takes to form one Japanese candle on the chart.
Horizontal channel (flat, sideways, range) — the price movement between support and resistance levels, without going beyond the given range.
К — simplified designation of one thousand dollars of the asset price (for example, 23.4K – $23,400).
Gray range on the chart — a support zone.
Red range on the chart — a resistance zone.
Correlation — the tendency of prices of different cryptocurrencies to move in sync, often influenced by the dominance of one of the assets.
Initial materials
This analysis was informed by the following educational materials and articles from GNcrypto:
Recommended

