MATIC and ATOM: Altcoin Analysis for September 14, 2023

Bitcoin continues to trade within the support and resistance zones highlighted in the previous analysis. Here’s a detailed market breakdown for MATIC (Polygon) and ATOM (Cosmos Hub) as of Thursday, September 14.
Polygon (MATIC)
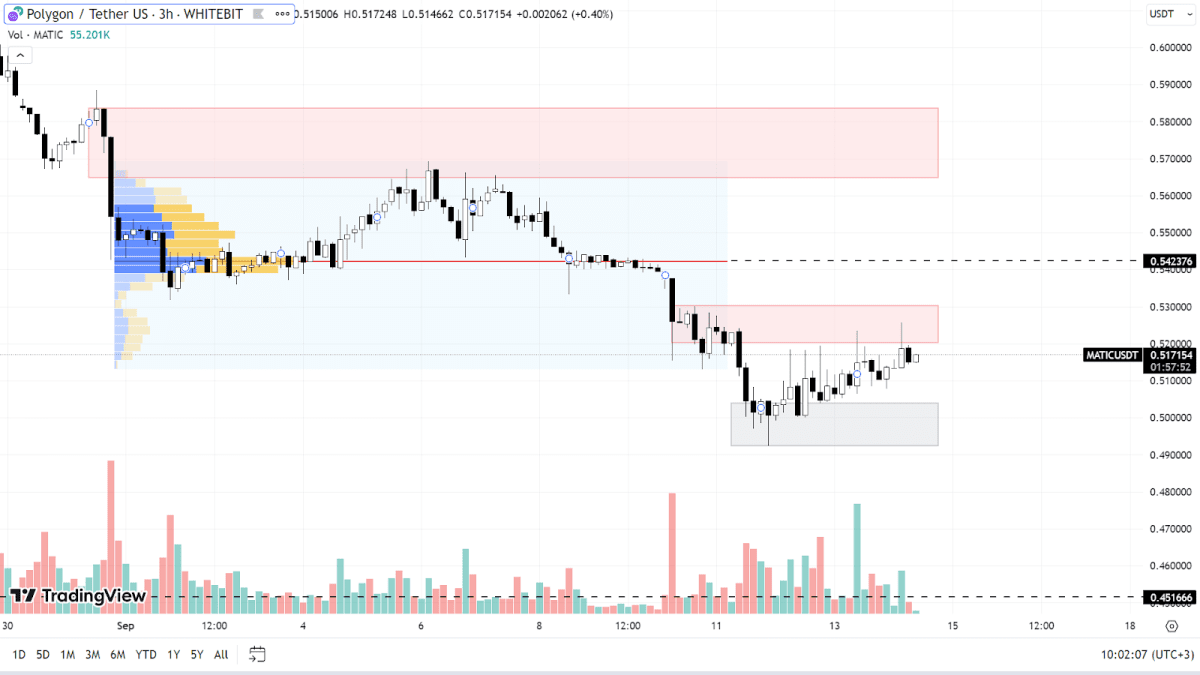
On September 11, MATIC hit a local low of $0.492. Both its global and locale trends remain bearish.
Currently, MATIC is trading between a support zone of $0.492-$0.50 and a resistance zone of $0.52-$0.53. To break out of this bearish pattern, buyers will need to surpass the current resistance, challenge the $0.542 level, and aim for the $0.565-$0.583 range. Buy orders above these points aren't relevant to our current analysis.
If the decline continues, pinpointing the next significant support is tricky since the MATIC price hasn't dipped this low in 2023. Hence, it might be useful to consider last year's demand levels, notably around the $0.45 and $0.40 marks.

MATIC chart on the H3 timeframe
Cosmos Hub (ATOM)
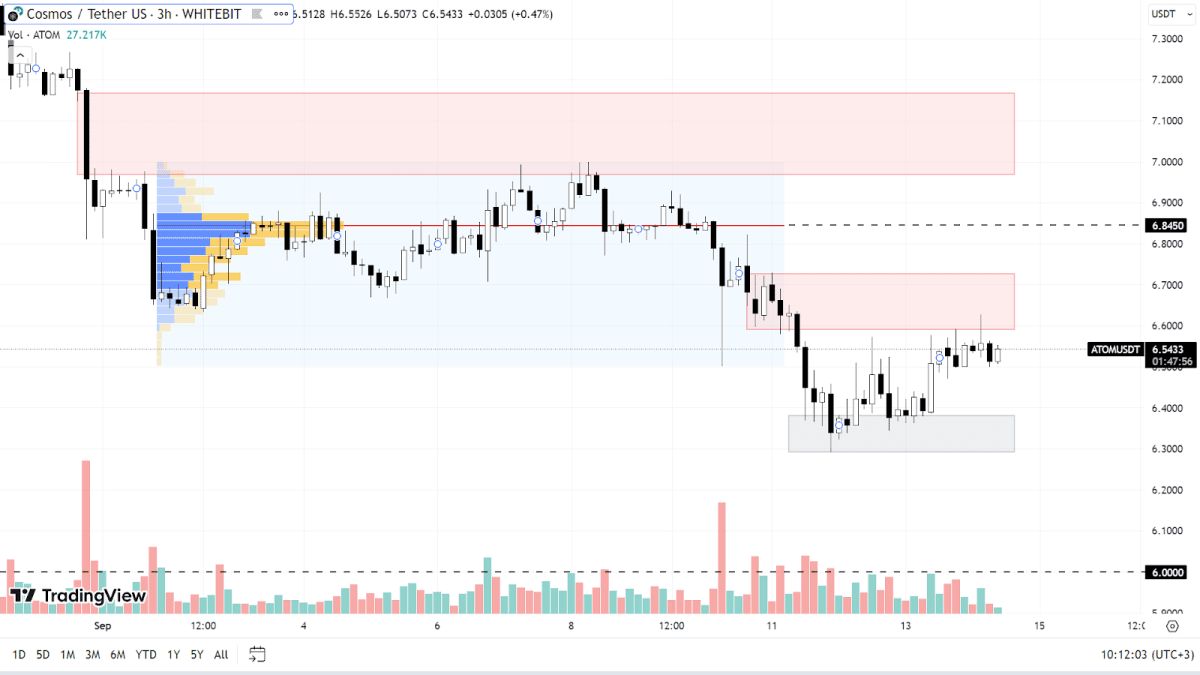
Just like Polygon's trend, ATOM reached its yearly low on September 11, touching the $6.29 mark. The decline intensified at July's end, resulting in a 30% drop over the following two months.
Currently, ATOM is trading sideways between the support zone of $6.29-$6.38 and a resistance zone of $6.59-$6.72. If this downward trajectory persists, the asset might dip to the $6 mark. Any subsequent support levels from 2020 are no longer pertinent.
Sell orders positioned above this resistance range from $6.84 to the $6.96-$7.16 zone. The downtrend will likely conclude once the asset's price consistently surpasses $8.5.

ATOM chart on the H3 timeframe
Altcoins exhibit a strong correlation with BTC, but it's more pronounced during downturns than during upward movements. Consequently, heightened BTC volatility often results in a so-called "hyperinflation" effect on altcoins, preventing them from recovering as much as they had initially dropped.
Additionally, the prices of ATOM and MATIC are influenced by fundamental factors, such as the SEC's deliberation on potentially categorizing certain cryptocurrencies as securities. While Ripple's court victory offered a positive sign, its impact was completely negated by ongoing pressures and news of challenges to the court's decision.
Check out GNcrypto for the latest cryptocurrency rates and chart analysis.
Disclaimer
Please note that the analysis provided above should not be considered a trading recommendation. These are solely the opinions of the GNcrypto editorial board regarding the market situation. Before opening any deals, we strongly advise conducting your own research and analysis.
Abbreviations
TF (Timeframe) — a chronological period equal to the time it takes to form one Japanese candle on the chart.
Horizontal channel (flat, sideways, range) — the movement of price between support and resistance levels, without going beyond the given range.
К — simplified designation of one thousand dollars of the asset price (for example, 23.4K - $23,400).
Gray range on the chart — a support zone.
Red range on the chart — a resistance zone.
Correlation — the tendency of prices of different cryptocurrencies to move in sync, often influenced by the dominance of one of the assets.
Initial materials
This analysis was informed by the following educational materials and articles from GNcrypto:
Recommended

