MATIC and TRX: Altcoin Analysis for October 5, 2023

The latest observations align with our prior analysis, with the chart indicating minimal BTC volatility. Here's an in-depth look at the market conditions for cryptocurrencies Polygon (MATIC) and Tron (TRX) as of Thursday, October 5.
Polygon (MATIC)
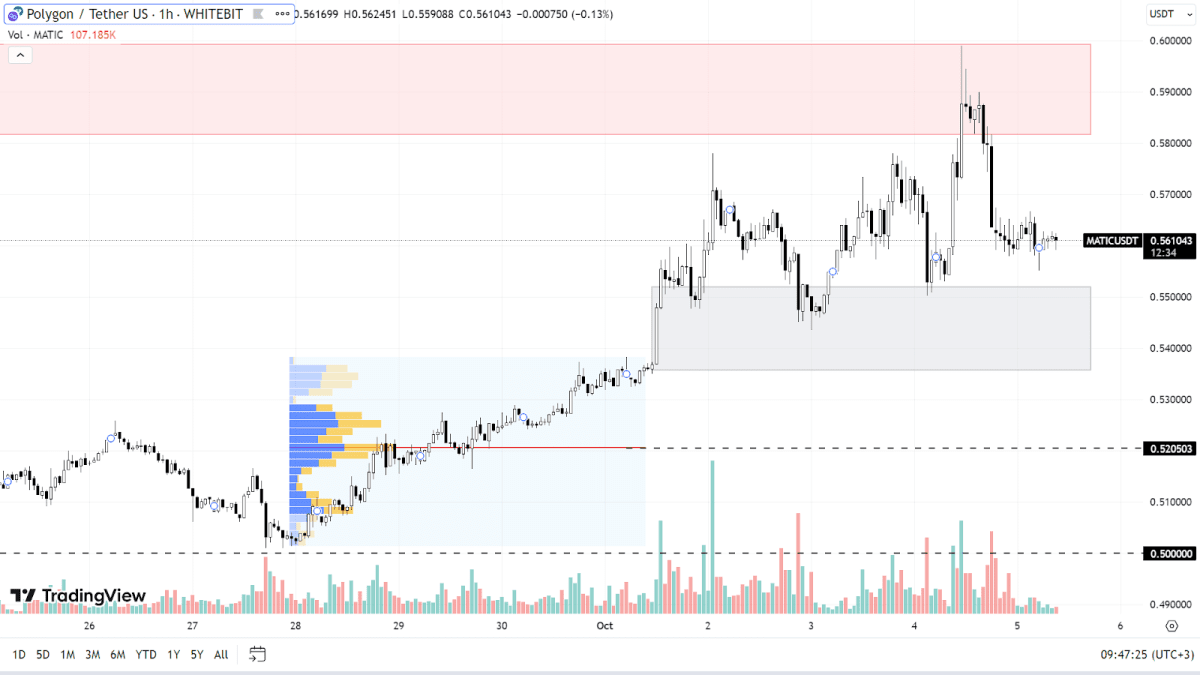
While the MATIC overall trend remains bearish, it has seen an impressive uptick over the past week, surging by 20% since September 28. This rise can largely be linked to Bitcoin's overall growth, suggesting a localized bullish pattern.
The asset is currently trading between the support levels of $0.535–$0.551 and resistance levels of $0.581–$0.600. The immediate outlook leans towards climbing higher, aiming for the next pockets of seller activity in the $0.621-$0.644 range and potentially beyond.
Should there be a downward shift, MATIC could fall back to the support level of $0.52, edging close to the psychological mark of $0.50, where a significant number of buy orders are placed.

MATIC chart on the H1 timeframe
Tron (TRX)
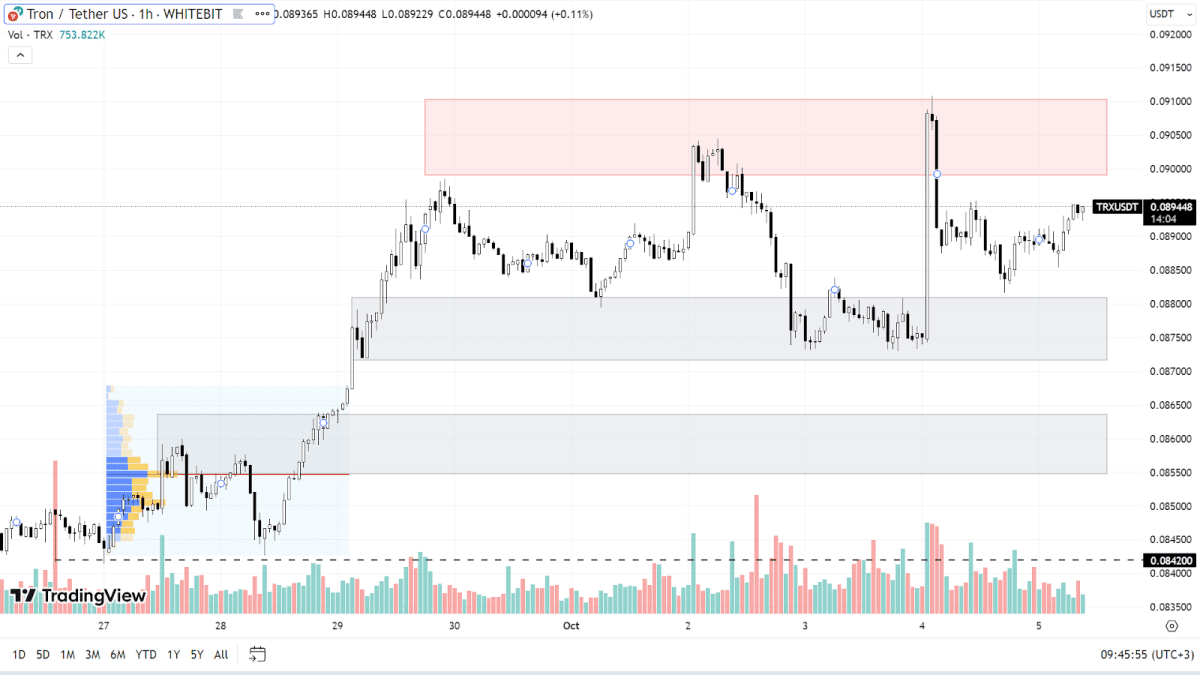
Tron has long decoupled from BTC, continuing its upward trend. Both its local and global trends are bullish, with the asset reaching a three-month high of $0.091 on October 4.
Since August 17, TRX has appreciated by 27%. It currently trades within the support level of $0.087–$0.088 and the resistance zone of $0.090–$0.091. The most likely scenario points to a continued upward movement, targeting the year's high of $0.094.
A short-term dip is also plausible, especially if BTC exhibits significant downturns. In that case, TRX might retreat to the buyer's zone around $0.0854-$0.0863 or drop to the support level at $0.084. A switch to a bearish trend seems unlikely for now.

TRX chart on the H1 timeframe
Today, the financial world is anticipating several pivotal macroeconomic announcements, notably the initial jobless claims and the U.S. trade balance figures. Although these reports don't fundamentally sway the cryptocurrency market, they could temporarily boost the volatility of the U.S. dollar, a factor worth considering for traders when making decisions.
Check out GNcrypto for the latest cryptocurrency rates and chart analysis.
Disclaimer
Please note that the analysis provided above should not be considered a trading recommendation. These are solely the opinions of the GNcrypto editorial board regarding the market situation. Before opening any deals, we strongly advise conducting your own research and analysis.
Abbreviations
TF (Timeframe) — a chronological period equal to the time it takes to form one Japanese candle on the chart.
Horizontal channel (flat, sideways, range) — the movement of price between support and resistance levels, without going beyond the given range.
К — simplified designation of one thousand dollars of the asset price (for example, 23.4K - $23,400).
Gray range on the chart — a support zone.
Red range on the chart — a resistance zone.
Correlation — the tendency of prices of different cryptocurrencies to move in sync, often influenced by the dominance of one of the assets.
Initial materials
This analysis was informed by the following educational materials and articles from GNcrypto:
Recommended

