MKR and FLOW: Altcoin Analysis for November 30, 2023

BTC continues its ascent, holding strong above the $37,500 mark. This sets the stage for an analysis of the market trends for alternative cryptocurrencies, specifically Maker (MKR) and Flow (FLOW), as of Thursday, November 30.
Maker (MKR)
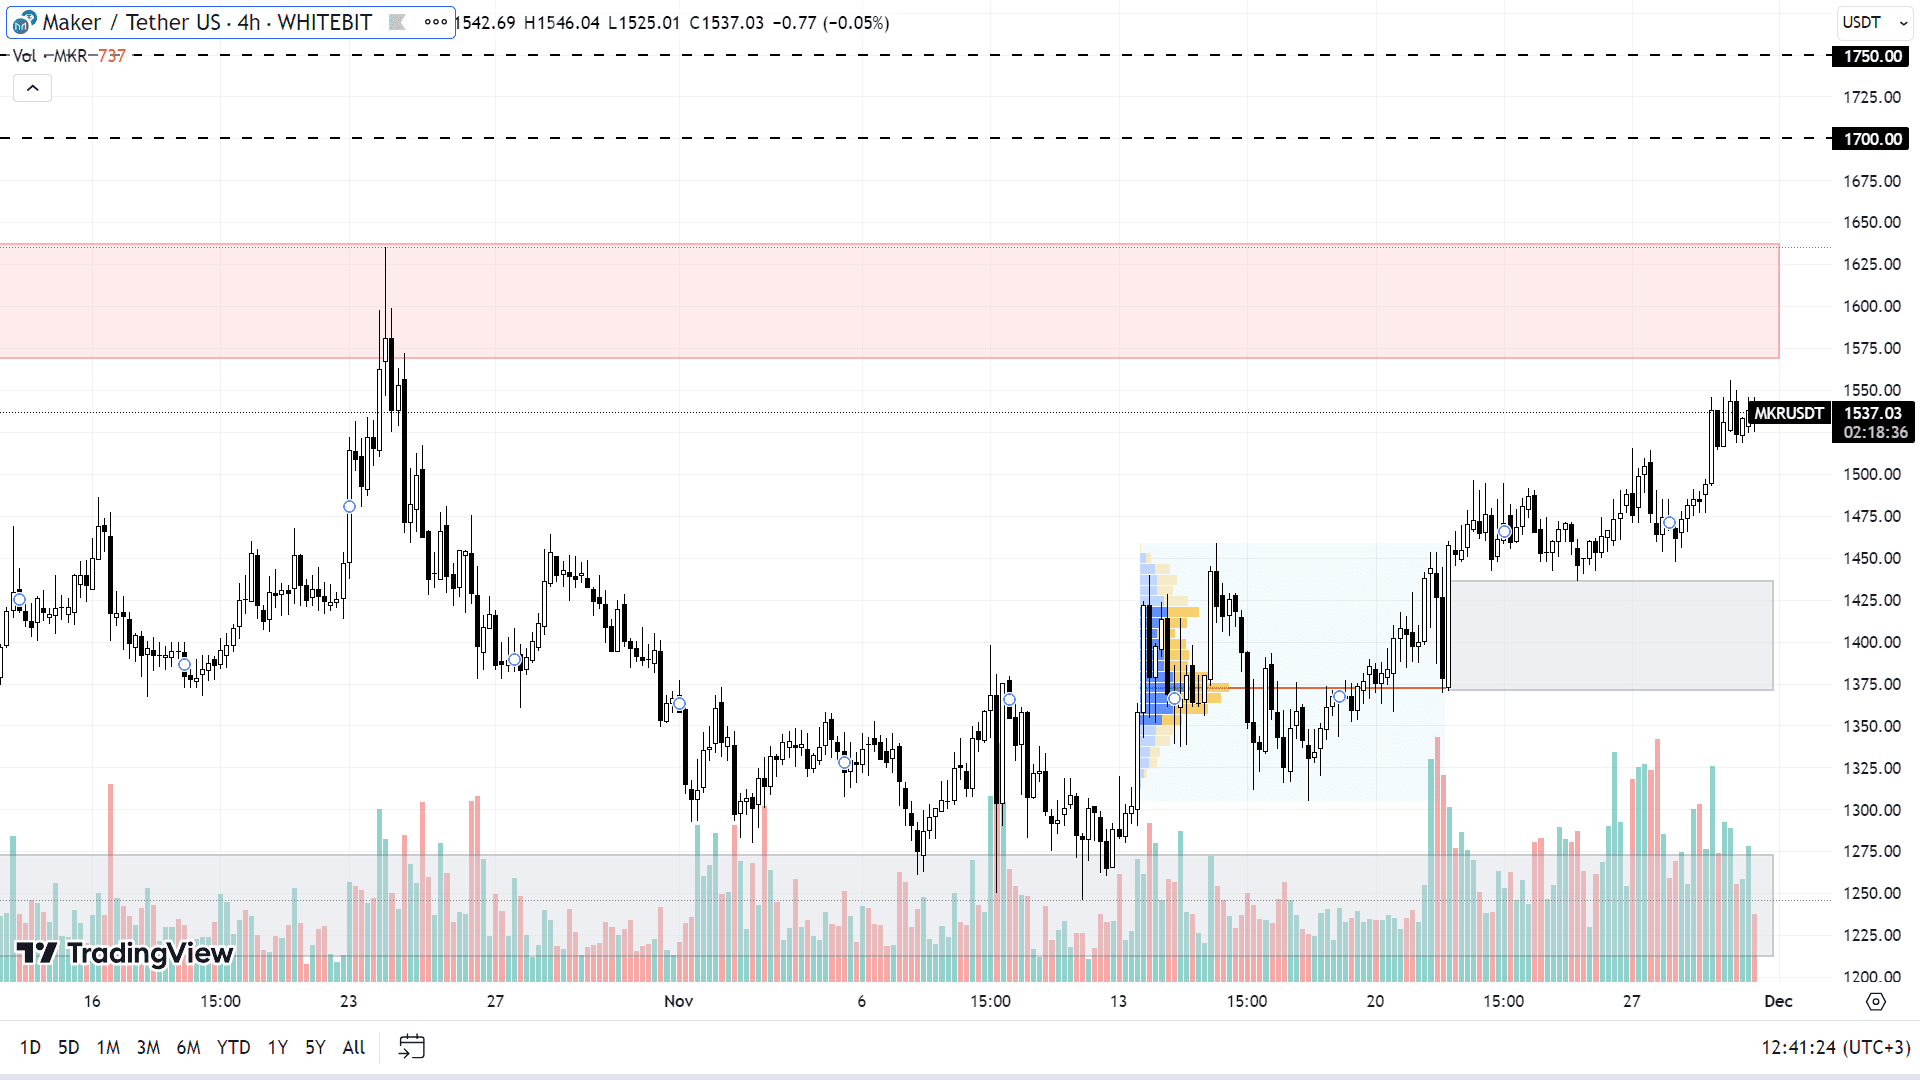
Maker exhibits a continuing upward trend, moving fluidly with occasional technical corrections and brief pullbacks. Currently, Maker is nearing the resistance zone between $1,568 and $1,637, coinciding with the asset's yearly high.
The primary objective for MKR now is to maintain its growth trajectory. Should buyers manage to break through the aforementioned resistance range expeditiously, MKR could potentially reach and stabilize around the $1,700 and $1,750 marks. This would likely be followed by a period of further temporary consolidation.
The MKR price movement is still closely linked with the BTC performance. Therefore, any downward shift in BTC's chart could similarly impact Maker. In such a scenario, MKR may test its support zone at $1,370-$1,435 and could even drop back into the buying range of $1,212-$1,272.
In the event of a deeper correction, MKR might be driven to test the buyer level around $1,130.

MKR chart on the H4 timeframe
Flow (FLOW)
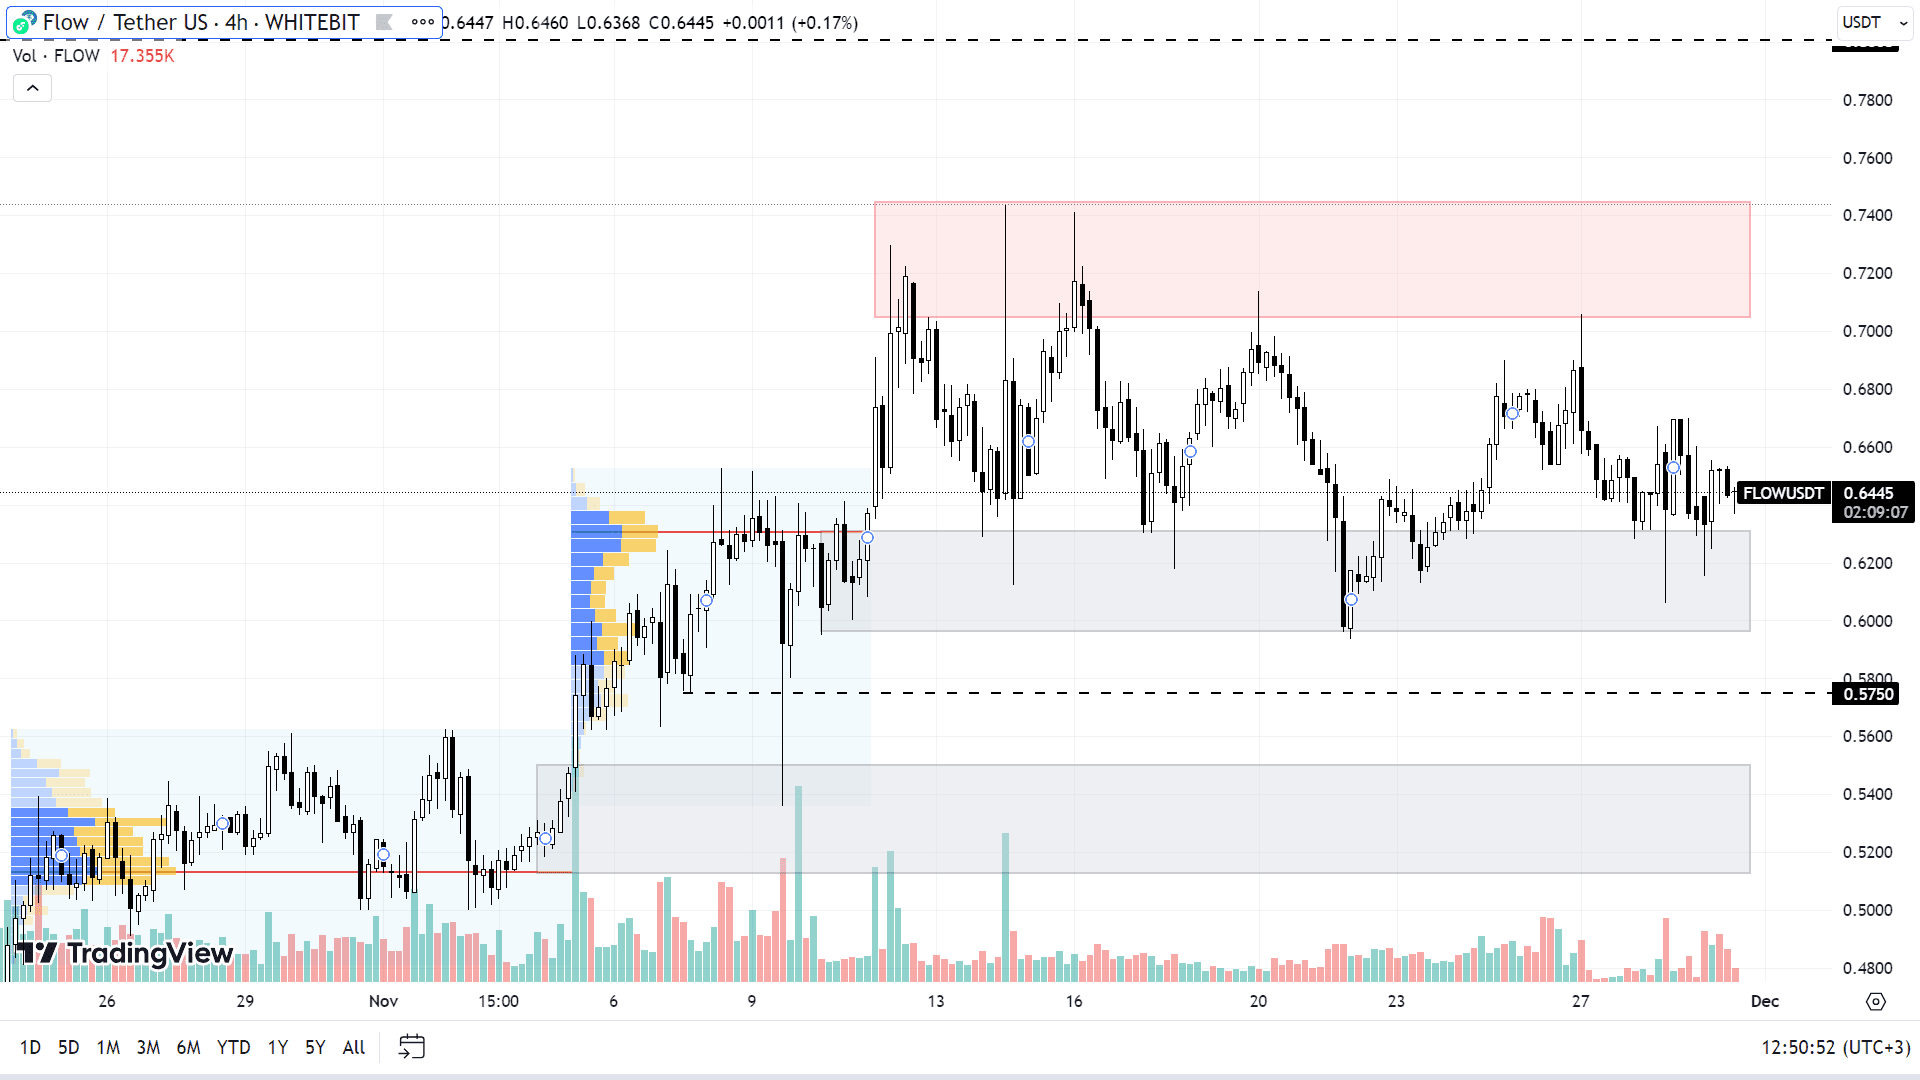
Since October 15, FLOW has experienced an 80% growth, now hovering near the buyer’s zone at $0.59-$0.63. Despite this increase, the asset hasn’t updated its annual high, suggesting there's still room for further growth.
Should Bitcoin maintain its positive trend, FLOW is expected to follow suit. The immediate target for FLOW is to retest its resistance zone between $0.705 and $0.745, aiming to reach and possibly exceed a local high of around $0.8.
Conversely, in the case of a market correction, FLOW might dip below its current buyer’s zone, potentially nearing the $0.575 level and testing the support range of $0.51-$0.55. However, such a downturn is more likely if BTC falls beneath the $35,000 threshold. Until then, altcoins, including FLOW, retain the potential to reach new price peaks.

FLOW chart on the H4 timeframe
Check out GNcrypto for the latest cryptocurrency rates and chart analysis.
Disclaimer
Please note that the analysis provided above should not be considered a trading recommendation. Before opening any deals, we strongly advise conducting your own research and analysis.
Abbreviations
TF (Timeframe) — a chronological period equal to the time it takes to form one Japanese candle on the chart.
Horizontal channel (flat, sideways, range) — the price movement between support and resistance levels, without going beyond the given range.
К — simplified designation of one thousand dollars of the asset price (for example, 23.4K – $23,400).
Gray range on the chart — a support zone.
Red range on the chart — a resistance zone.
Correlation — the tendency of prices of different cryptocurrencies to move in sync, often influenced by the dominance of one of the assets.
Initial materials
This analysis was informed by the following educational materials and articles from GNcrypto:

