Monday on the Crypto Scene: BTC and ETH Analysis. August 7, 2023

The cryptocurrency market had a predictably calm weekend with slight volatility. Here's the market situation for Bitcoin (BTC) and Ethereum (ETH) as of Monday, August 7.
Bitcoin (BTC)
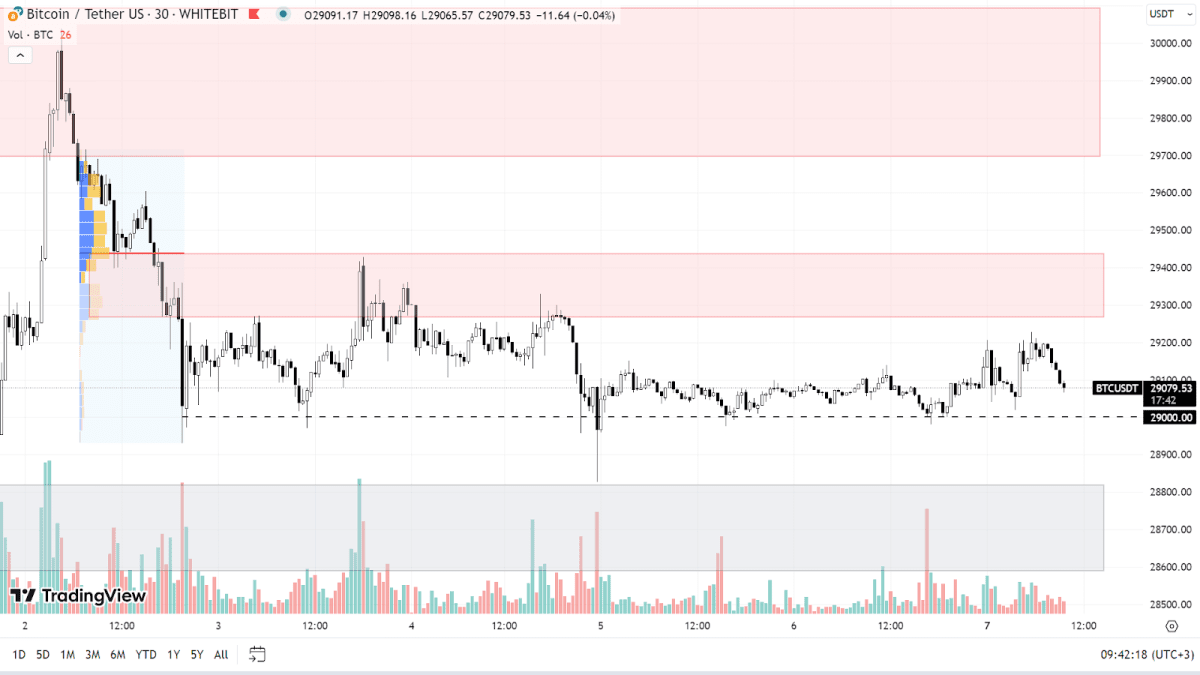
Throughout Saturday and Sunday, BTC fluctuated between the support level of $29,000 and the resistance range of $29,250-$29,450. If this upward trend persists, the buyers will face the next resistance zone at $29,700-$30,100, and at the $30,400 level.
Even though BTC has been upward since the start of the year, there isn't a defined trend on a lower timeframe (M30). As such, a deeper retreat seems a likely scenario. Under these circumstances, Bitcoin might drop to a local low below the $28,000 mark, with the subsequent trading activity providing a measure of trader sentiment.

BTC chart on the 30m timeframe
Ethereum (ETH)
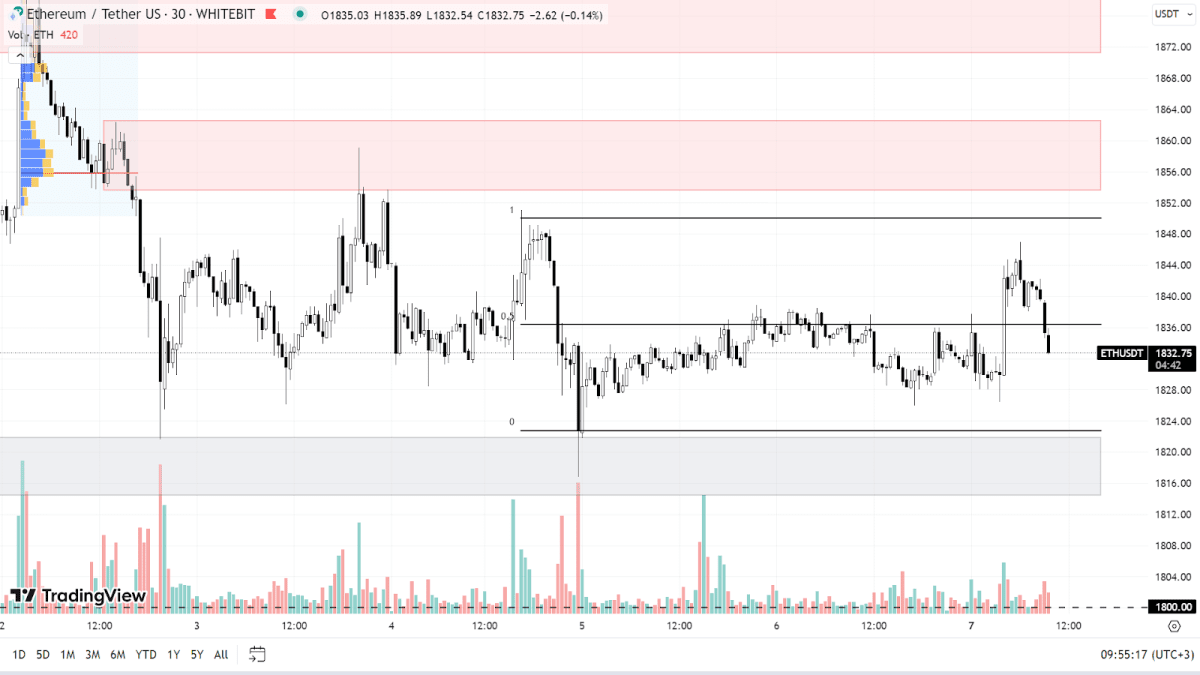
Due to the strong correlation between BTC and ETH, there haven't been any notable shifts on Ethereum's chart at timeframes exceeding an hour since our last analysis. As such, let's look at a lower timeframe (M30) to identify local market trends.
The ETH price is currently wedged in a sideways trend between support at $1,822 and resistance at $1,850. For a break above this consolidation range, buyers need to clear the resistance areas of $1,853-$1,863 and $1,872-$1,880, after which it will be crucial to sustain above the $1,885 level. Given the dense sell-side pressure within these areas, it seems plausible that the ongoing correction might continue further.
If prices dip, ETH may fall below its recent low in the $1,814-$1,822 zone, and potentially test the $1,800 mark. The previously discussed support and resistance levels remain pertinent to our current analysis.

ETH chart on the 30m timeframe
This week will unveil several key economic data points. Notably, on August 10, we'll receive figures on the U.S. unemployment rate and the Consumer Price Index (CPI), which indicates inflation levels. Leading up to these releases, we might see a lull in asset volatility. The broader economic landscape should become clearer following the CPI announcement, which could subsequently shape cryptocurrency movements.
Check out GNcrypto for the latest cryptocurrency rates and chart analysis.
Disclaimer
Please note that the analysis provided above should not be considered a trading recommendation. These are solely the opinions of the GNcrypto editorial board regarding the market situation. Before opening any deals, we strongly advise conducting your own research and analysis.
Abbreviations
TF (Timeframe) — a chronological period equal to the time it takes to form one Japanese candle on the chart.
Horizontal channel (flat, sideways, range) — the movement of price between support and resistance levels, without going beyond the given range.
К — simplified designation of one thousand dollars of the asset price (for example, 23.4K - $23,400).
Gray range on the chart — a support zone.
Red range on the chart — a resistance zone.
Correlation — the tendency of prices of different cryptocurrencies to move in sync, often influenced by the dominance of one of the assets.
Initial materials
This analysis was informed by the following educational materials and articles from GNcrypto:
Recommended

