RNDR and ARB: Altcoin Analysis for December 7, 2023

Bitcoin continues its ascent, holding firm above the $43,000 mark. Here's an analysis of the market situation for the altcoins Render (RNDR) and Arbitrum (ARB) as of Thursday, December 7.
Render (RNDR)
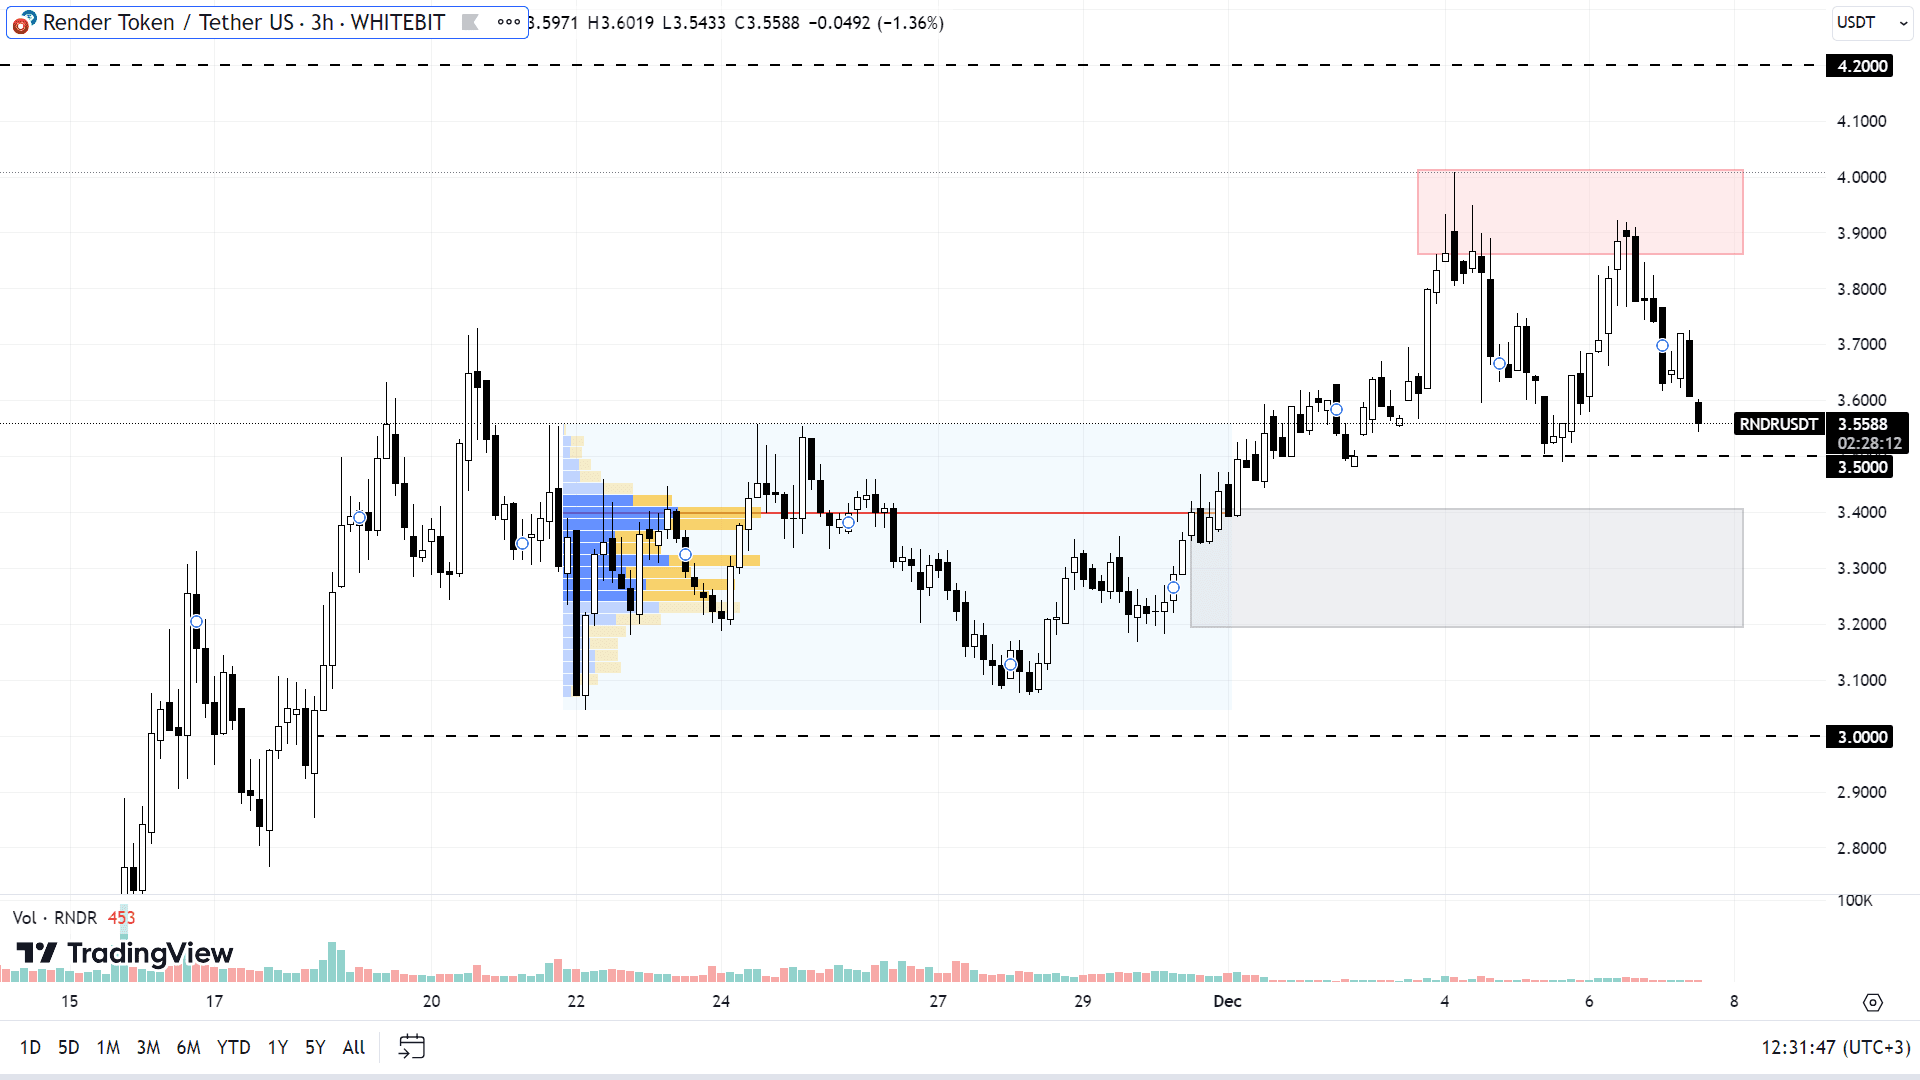
The price chart for Render shows a sustained upward trajectory, with the asset increasing in value by 200% over the past three months. RNDR's performance has been partly influenced by its correlation with Bitcoin, contributing to a 131% rise since October 16.
As of now, RNDR is fluctuating between a support level of $3.5 and a resistance zone ranging from $3.86 to $4.00. The most likely scenario is a continuation of this upward trend, potentially reaching a new yearly high. In the near term, Render could test and potentially surpass the $4.2 level, further validating the buying momentum.
Should there be a short-term decrease, RNDR might approach the support area between $3.2 and $3.4 and test the $3 mark. A transition to a downtrend could be on the horizon if the RNDR price firmly settles below $2.2.


RNDR chart on the H3 timeframe
Arbitrum (ARB)
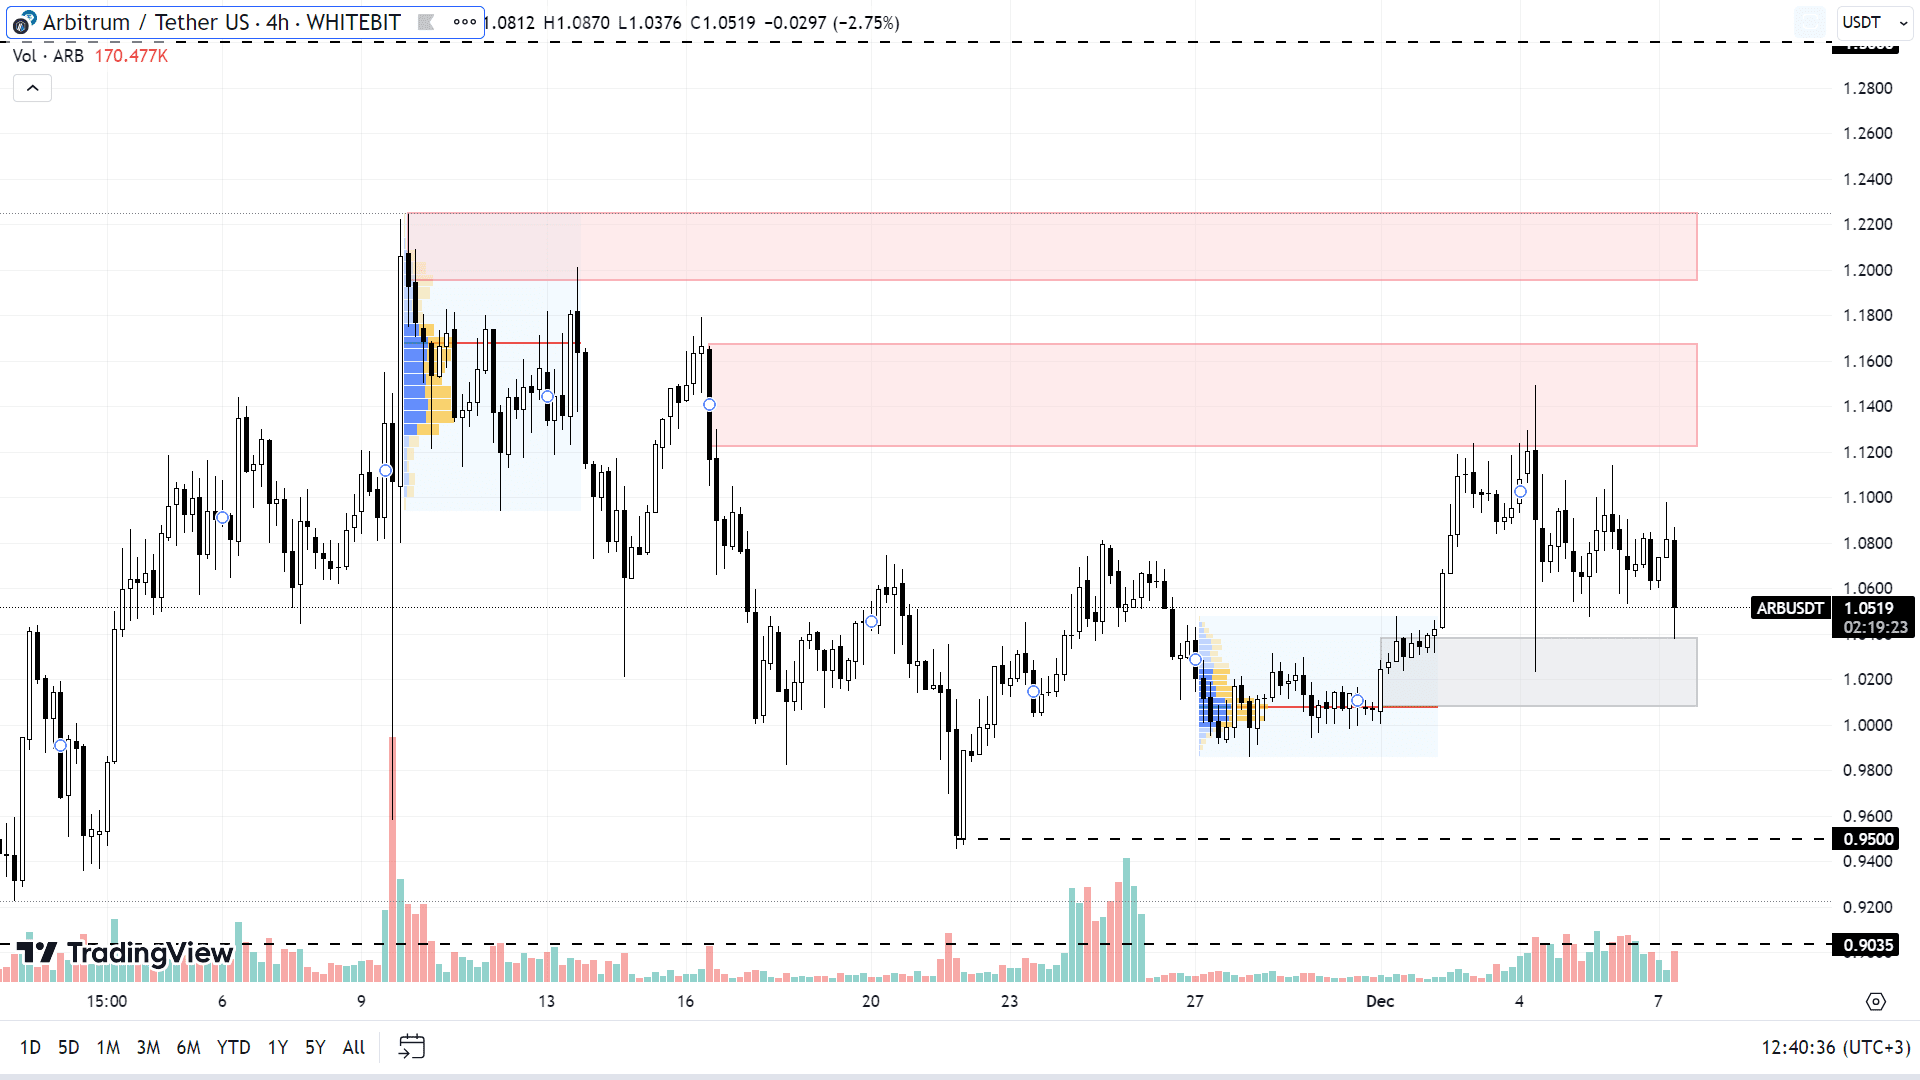
In contrast to several altcoins that have witnessed rapid price surges, ARB has been experiencing a more gradual increase. Since October 16, ARB has grown by 45%, yet it hasn't broken past its annual high of $1.82, indicating potential room for further growth.
Arbitrum is currently in a consolidation phase, hovering between the support range of $1.00-$1.04 and a resistance band of $1.12-$1.16. If it successfully breaches this resistance, the ARB price might test higher levels in the $1.19-$1.23 range and approach its local high near $1.3.
It's important to note that any downward correction in Bitcoin's price could have a negative impact on ARB. In such an event, the token might slide below the key psychological level of $1, potentially exploring lower levels around $0.95 and $0.90.


ARB chart on the H4 timeframe
Check out GNcrypto for the latest cryptocurrency rates and chart analysis.
Disclaimer
Please note that the analysis provided above should not be considered a trading recommendation. Before opening any deals, we strongly advise conducting your own research and analysis.
Abbreviations
TF (Timeframe) — a chronological period equal to the time it takes to form one Japanese candle on the chart.
Horizontal channel (flat, sideways, range) — the price movement between support and resistance levels, without going beyond the given range.
К — simplified designation of one thousand dollars of the asset price (for example, 23.4K – $23,400).
Gray range on the chart — a support zone.
Red range on the chart — a resistance zone.
Correlation — the tendency of prices of different cryptocurrencies to move in sync, often influenced by the dominance of one of the assets.
Initial materials
This analysis was informed by the following educational materials and articles from GNcrypto:

