SOL and LTC Altcoin Analysis for October 31, 2023

Bitcoin has been trading sideways for over a week now, with no notable changes in its chart since our last review. Here’s an analysis of the market situation for Solana (SOL) and Litecoin (LTC) as of Tuesday, October 31.
Solana (SOL)
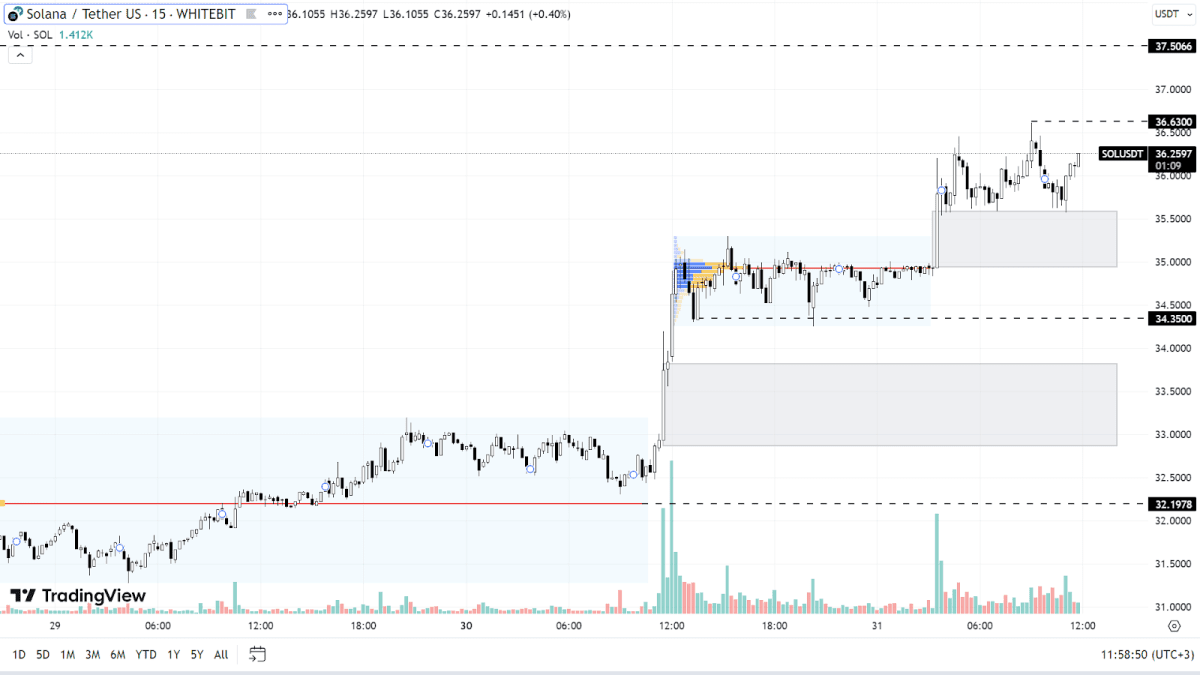
Solana has been on an active upward trend for more than two months. Since September 8, the asset has increased by 100%, setting a new local high at $36.61. This growth is attributable to both the rise of Bitcoin and a resurgence of interest in the Solana ecosystem.
At present, the asset is trading between the support zone of $34.90-$35.50 and the resistance level of $36.63. The continuation of growth is currently the most likely scenario, with the next targets for buyers being $37.5 and $39.
A temporary correction on the SOL chart would also be acceptable within the confines of the current trend. Below the existing support zone, there is a level at $34.35, followed by a wide range of buyers' bids between $32.8 and $33.8. Additionally, the level at $32.2, where numerous open long orders are concentrated, is noteworthy.

SOL chart on the M15 timeframe
Litecoin (LTC)
Contrary to other cryptocurrencies, Litecoin exhibits less dynamism and activity. This can be attributed to the decreased interest in “older” coins from buyers, who seem to prefer new and developed blockchains.
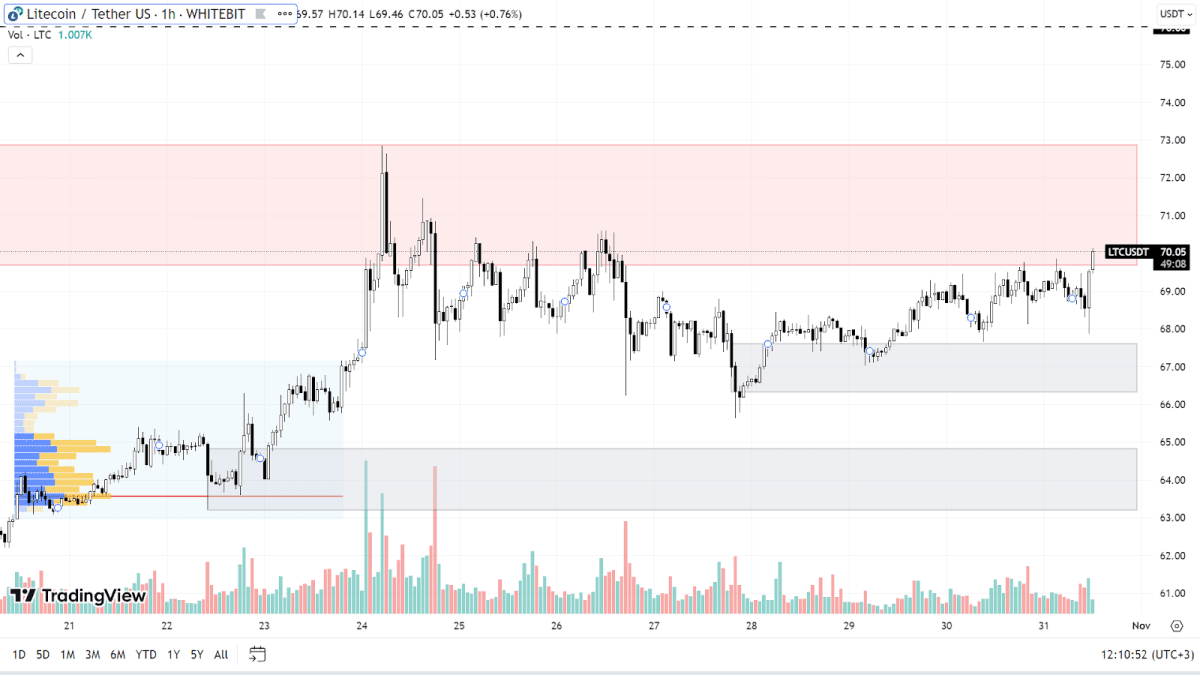
Nonetheless, LTC has come remarkably close to the resistance zone of $70.00-$72.87, opening up the possibility of breaking out of the sideways trend that has persisted for three months. The boundaries of this range were outlined in our previous analysis.
Should buyers successfully navigate through the current resistance zone, LTC could initiate an upward trend, aiming for highs at the $76 and $79 levels. These points serve as the initial targets for buyers in the event of LTC's growth.
A correction in the BTC chart might similarly impact the LTC price. At present, the relevant support zones are found within the ranges of $66.3-$67.6 and $63.2-$64.8. However, if Bitcoin falls by 5-10% in a short span, LTC could quickly plummet due to the apparent lack of buying strength in its chart (at least at the time of writing this review), easily breaking through all the existing support zones.

LTC chart on the H1 timeframe
Check out GNcrypto for the latest cryptocurrency rates and chart analysis.
Disclaimer
Please note that the analysis provided above should not be considered a trading recommendation. Before opening any deals, we strongly advise conducting your own research and analysis.
Abbreviations
TF (Timeframe) — a chronological period equal to the time it takes to form one Japanese candle on the chart.
Horizontal channel (flat, sideways, range) — the price movement between support and resistance levels, without going beyond the given range.
К — simplified designation of one thousand dollars of the asset price (for example, 23.4K – $23,400).
Gray range on the chart — a support zone.
Red range on the chart — a resistance zone.
Correlation — the tendency of prices of different cryptocurrencies to move in sync, often influenced by the dominance of one of the assets.
Initial materials
This analysis was informed by the following educational materials and articles from GNcrypto:
Recommended

