SOL and XLM: Altcoin Analysis for September 26, 2023

The BTC chart has seen no significant changes since our last analysis. Let’s take a closer look at the market conditions for the cryptocurrencies Solana (SOL) and Stellar (XLM) as of Tuesday, September 26.
Solana (SOL)
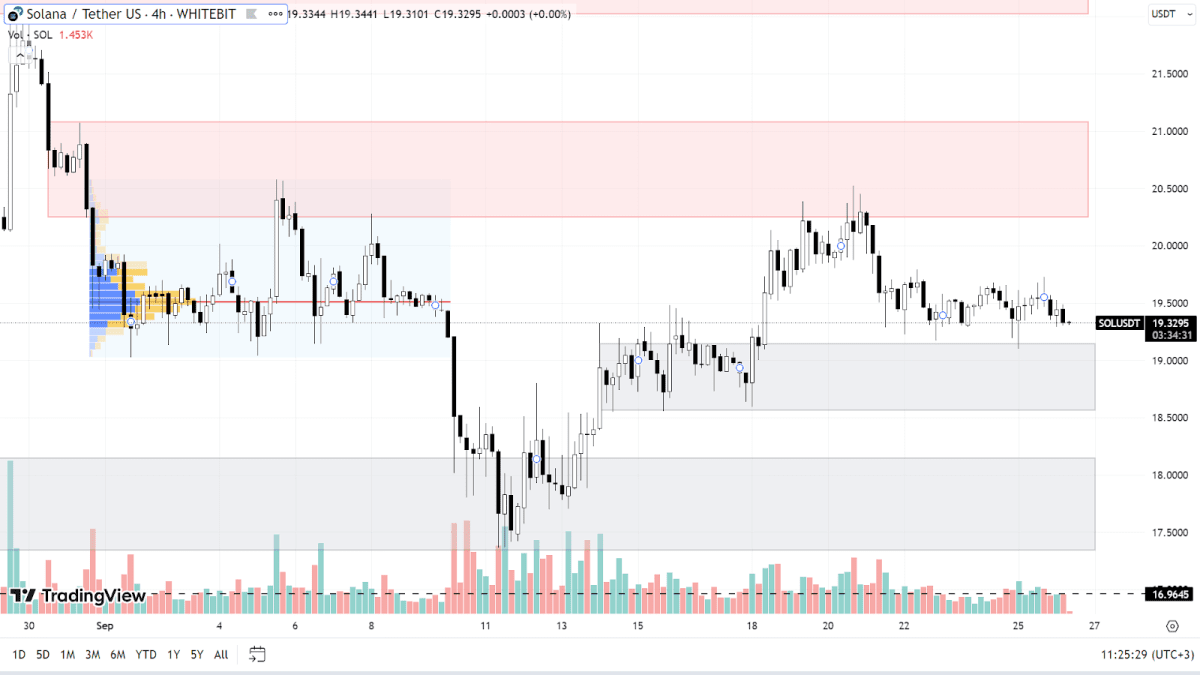
Both global and local trends on the SOL chart remain bearish. After testing the resistance zone of $20.25-$21.00, the asset continued its decline, probing the support zone of $18.50-$19.15.
If buyers show strength and manage to maintain this range, SOL might commence a focused upward movement. In this case, seller reaction can be expected within the $20.25-$21.00 and $22-$23 zones. Securing above the $23 level would indicate a change in the local market trend to bullish.
However, as long as BTC continues its decline, a correction in the altcoin charts also remains the priority scenario. Below the current support, buyers have placed their orders within the range of $17.35-$18.15 and at the $16.96 level. However, the asset may hit a new low in the case of negative news or an abnormally sharp drop in BTC's rate.

SOL chart on the H4 timeframe
Stellar (XLM)
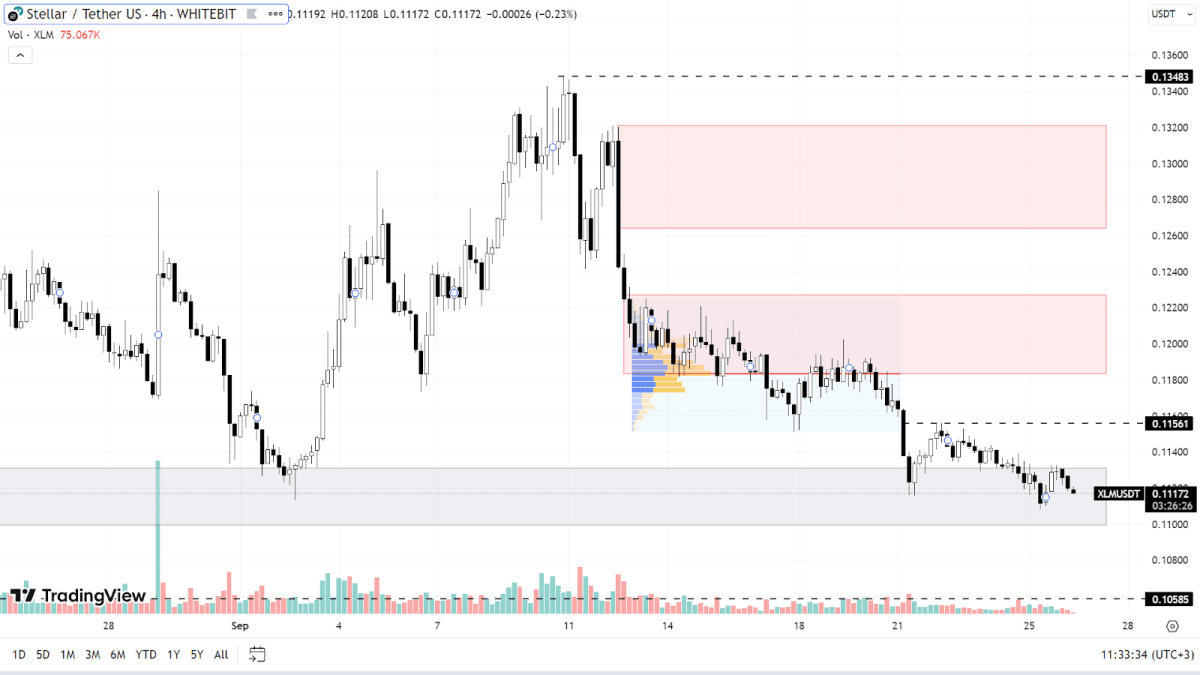
Since the last analysis of the XLM chart, two months have elapsed, and Stellar hasn't managed to sustain the elevated levels it reached following XRP’s legal triumph against the SEC. At present, the asset is exhibiting a downward trend, hovering within the support range of $0.110-$0.113.
The ongoing decrease in the XLM price appears to be the most plausible scenario. If this buyer range fails to hold, the subsequent support level anticipated is $0.105, followed by the so-called “psychological level” at $0.100.
To initiate an upward trajectory, Stellar needs to surpass several significant resistance levels, notably $0.115, zones $0.118-$0.122 and $0.126-$0.132, and the $0.135 mark. Only consolidation above this final level will indicate a transition towards an ascending trend.

XLM chart on the H4 timeframe
Several pieces of crucial economic news are due today, encompassing the number of building permits issued, the consumer confidence index, and U.S. new housing sales figures. While these elements don’t directly impact altcoins, they can induce heightened volatility in the BTC chart. Given the correlation of other currencies with Bitcoin, the entire crypto market tends to react similarly to such news. It is advisable to minimize position risks and proceed with utmost caution in trading.
Check out GNcrypto for the latest cryptocurrency rates and chart analysis.
Disclaimer
Please note that the analysis provided above should not be considered a trading recommendation. These are solely the opinions of the GNcrypto editorial board regarding the market situation. Before opening any deals, we strongly advise conducting your own research and analysis.
Abbreviations
TF (Timeframe) — a chronological period equal to the time it takes to form one Japanese candle on the chart.
Horizontal channel (flat, sideways, range) — the movement of price between support and resistance levels, without going beyond the given range.
К — simplified designation of one thousand dollars of the asset price (for example, 23.4K – $23,400).
Gray range on the chart — a support zone.
Red range on the chart — a resistance zone.
Correlation — the tendency of prices of different cryptocurrencies to move in sync, often influenced by the dominance of one of the assets.
Initial materials
This analysis was informed by the following educational materials and articles from GNcrypto:
Recommended

