SUI and APT Altcoin Analysis for November 28, 2023

With Bitcoin holding steady at around $37,000 with minimal volatility, the insights from yesterday's analysis continue to apply. Therefore, let's turn our attention to the market situation of Sui (SUI) and Aptos (APT) as of Tuesday, November 28.
Sui (SUI)
SUI continues to show positive momentum, attributed to both the rising trend of BTC and increased user activity on the Sui network. In the past two months, the blockchain's TVL has increased fivefold, currently standing at $140 million.
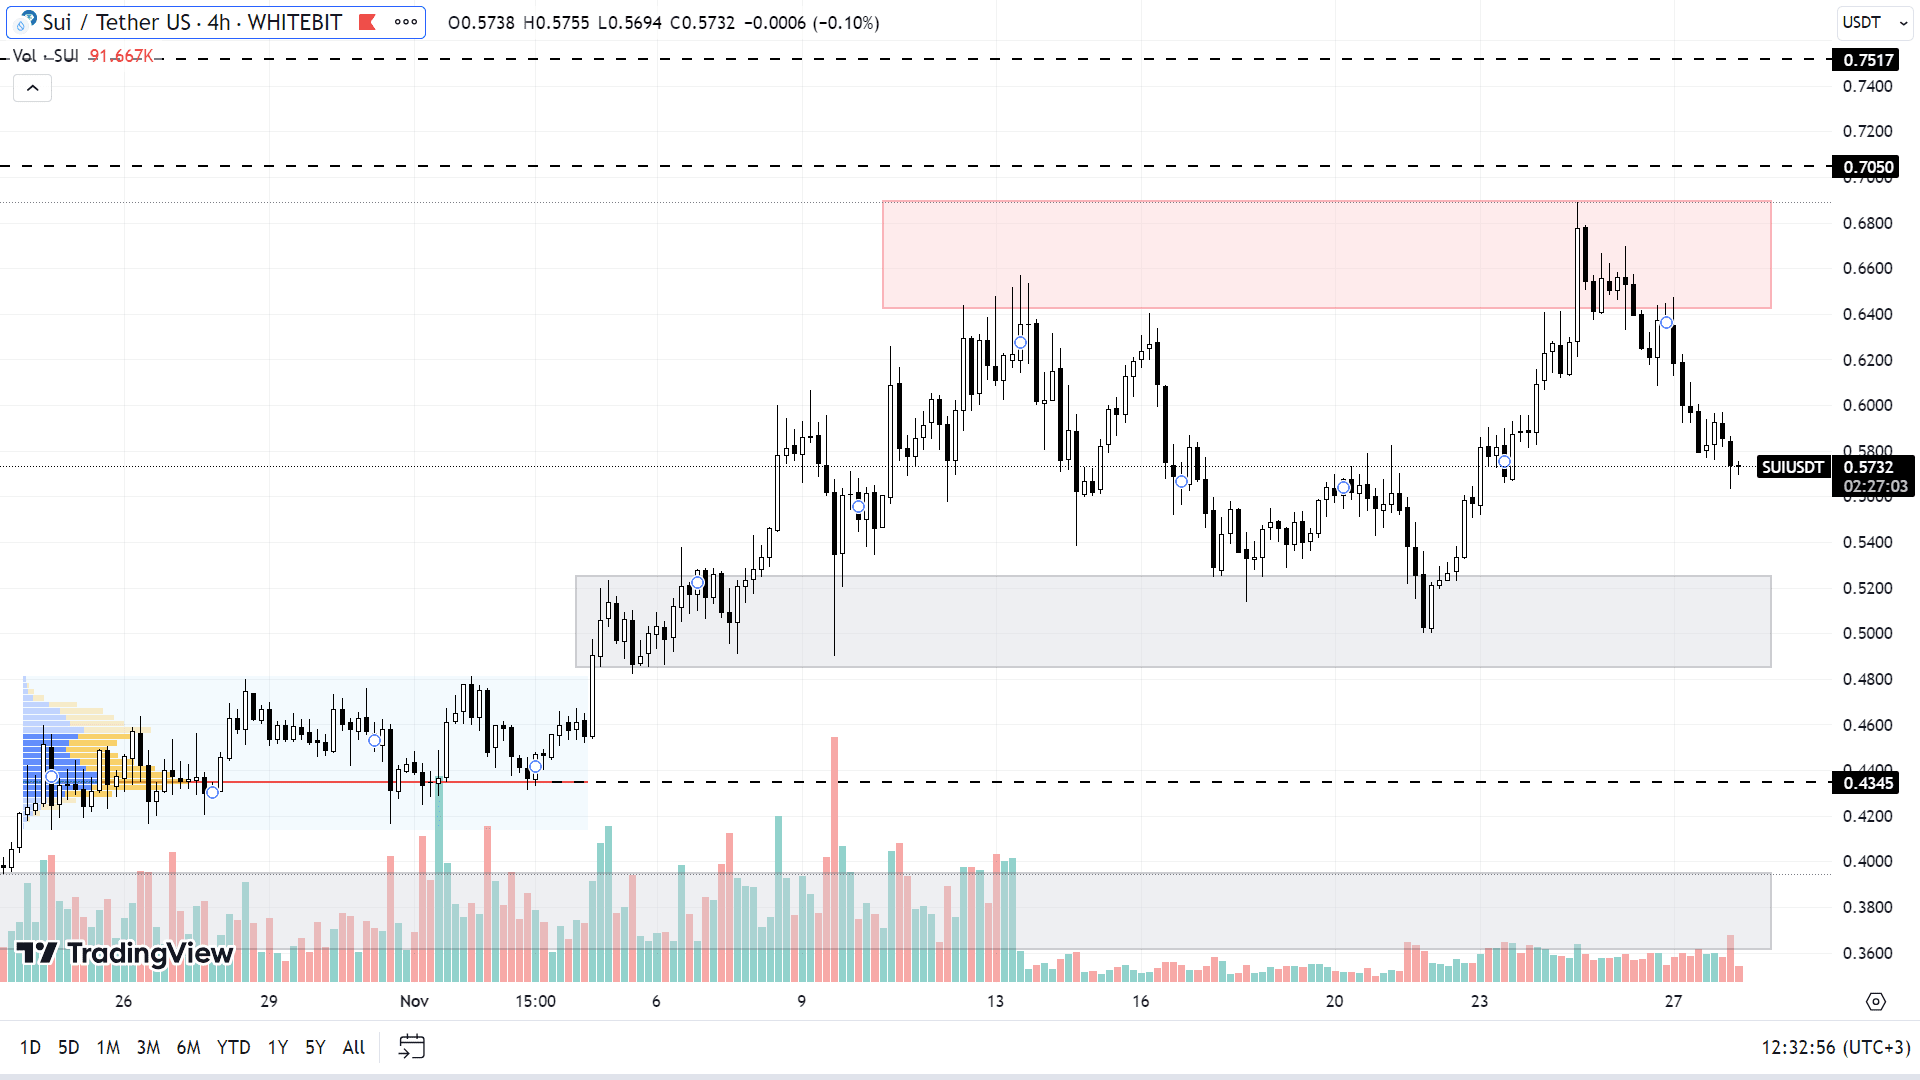
SUI is currently trading within a wide sideways range, with its support zone between $0.48 and $0.52 and resistance range between $0.64 and $0.69. The asset's primary aim is to sustain its growth trajectory and reach new local highs, with upcoming targets for buyers at $0.70 and $0.75.
However, in the event of a BTC correction and upcoming large-scale token unlocks, there is a risk that Sui might undergo a substantial drop. If this occurs, the coin's price could potentially fall to $0.43, approaching its historic low range of $0.36 to $0.40, which would be a significant test of the project's stability.

SUI chart on the H4 timeframe
Aptos (APT)
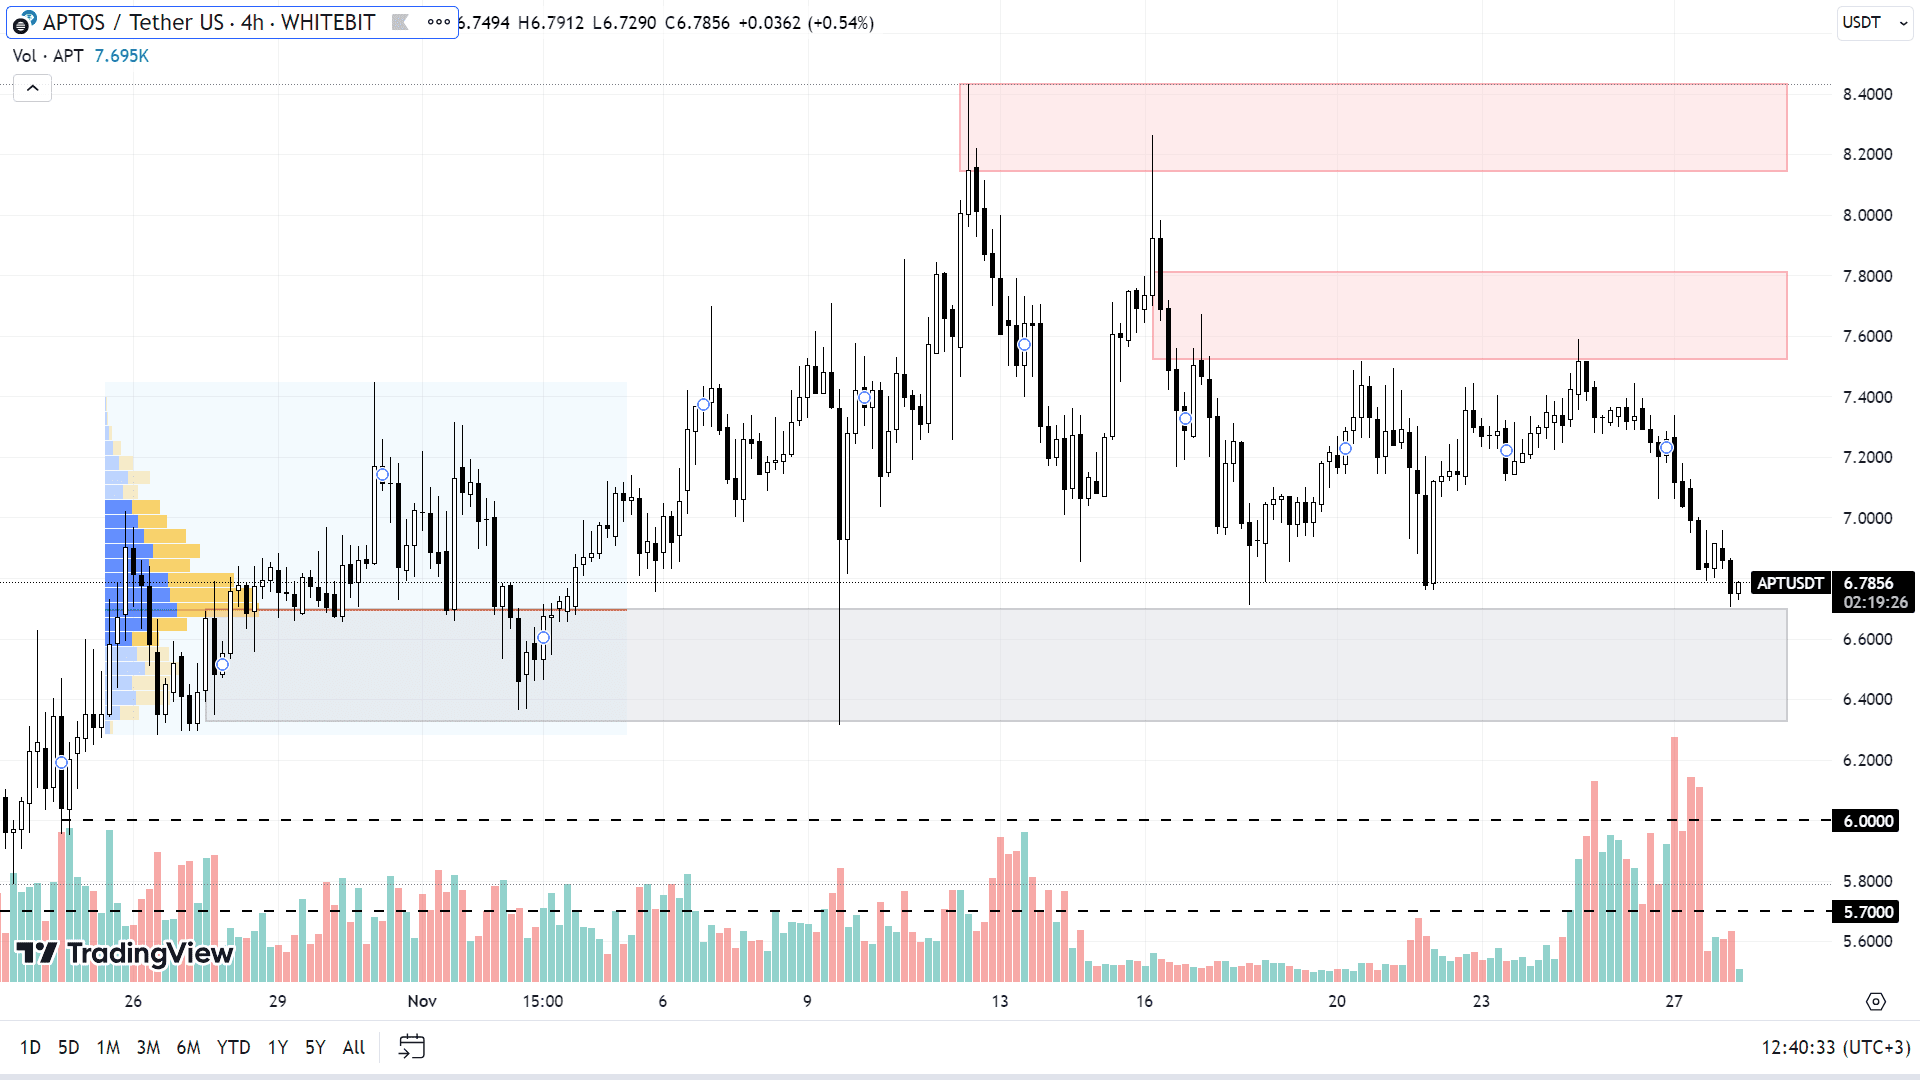
In the past month and a half, the APT price has increased by 70%. However, following the achievement of a new local high at $8, the asset began a gradual decline, undergoing a local correction of approximately 20%.
Currently, the APT price is nearing an important support zone between $6.32 and $6.70. If the upward trend in Bitcoin's chart continues, buying APT at this range could be a good option. In this scenario, APT might resume its upward trend, targeting seller zones at $7.52-$7.81 and $8.14-$8.43, with the potential to reach new highs.
However, a correction in Bitcoin’s price could negatively affect APT. In this case, APT could break through its current range and set new lower levels at around $6.0 and $5.7.

APT chart on the H4 timeframe
Check out GNcrypto for the latest cryptocurrency rates and chart analysis.
Disclaimer
Please note that the analysis provided above should not be considered a trading recommendation. Before opening any deals, we strongly advise conducting your own research and analysis.
Abbreviations
TF (Timeframe) — a chronological period equal to the time it takes to form one Japanese candle on the chart.
Horizontal channel (flat, sideways, range) — the price movement between support and resistance levels, without going beyond the given range.
К — simplified designation of one thousand dollars of the asset price (for example, 23.4K – $23,400).
Gray range on the chart — a support zone.
Red range on the chart — a resistance zone.
Correlation — the tendency of prices of different cryptocurrencies to move in sync, often influenced by the dominance of one of the assets.
Initial materials
This analysis was informed by the following educational materials and articles from GNcrypto:

