Trading imbalances: what are they and how can you use them?

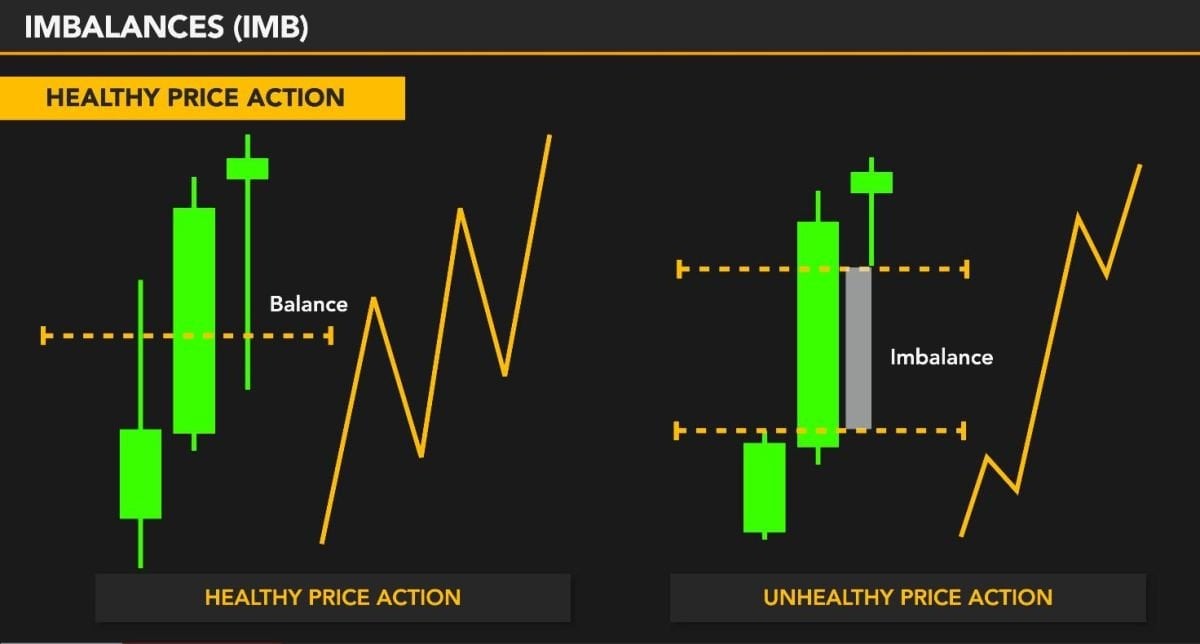
A trading imbalance occurs when there are too many buy or sell orders, forming a gap that can be spotted on the charts. For trading decisions, gaps like these are useful.
A lack of equilibrium between buy and sell orders is considered imbalance.

Imbalance illustrations
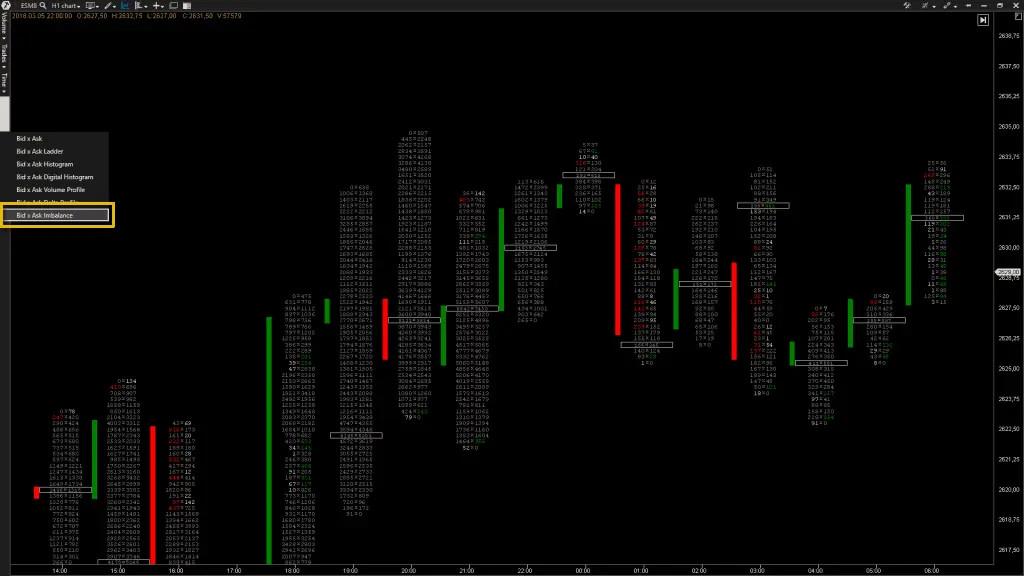
Traders use cluster charts or footprints to track it, with color indicating a significant excess of "bids" or "asks". It is inefficient and time-consuming to do this manually, so they rely on software.
The imbalance footprint additionally highlights in color those price levels at which market players reacted aggressively.
Imbalance formation
Traditionally, at a single price level, there are volumes traded on the bid and ask sides. Imbalance compares bid and ask diagonally and shows a significant excess of one over the other. This means that the bid is compared to the ask level above and the ask is compared to the bid level below.

Tracking an imbalance via footprint.
Identifying price reversals is a prime example of the low-risk application of imbalances. It is advisable to watch for reversals at significant levels such as the day's high/low or support/resistance levels.
Possible signs of a reversal at a critical level may include the following:
• Opposite imbalance formation. For example, a negative imbalance only at the day's high or a positive imbalance only at the day's low. Multiple imbalances or imbalances at a minimum of three consecutive price levels are even more significant. They typically occur when large players enter the market and place an order of significant volume at a single price level;
• The absence of the same colour imbalance in bars following a trend movement.
• A bar with a long shadow is another example. Indicates a struggle between a large number of buyers and sellers.
• The maximum volume zone moves in the opposite direction of the trend.
• A large volume without imbalance indicates a scramble between buyers and sellers.
Imbalances provide "fuel" for a trend in price movement, as they represent aggressive volumes.
Market makers typically hold a certain amount of an asset in reserve. When there is a gap in the market, they add liquidity to the asset to fill it and ensure that trading continues at a fair price.
It's not wise to consider every imbalance zone as a magical sign and enter trades blindly. It's preferable to observe the formation of any patterns around it and make decisions based on price behavior.
Imbalances can appear on any market after the release of significant news. This includes reports on the profits or losses of major players, the acquisition of one company by another, the leak of sensitive information, and so on. The cryptocurrency market is one of the most volatile, so significant gaps between highs and lows are quite common there. However, conspiracy theories and insider information leaks cannot be ruled out.
Typically, imbalances are resolved within a few minutes or hours, depending on the timeframe a trader is operating in. In rare cases, it may take several trading sessions to close the imbalance.
Benefits of imbalance utilization
- Indicates entry points.
- Identifies trends and their start.
- You are able to take the right side and minimize your losses.
- Confirms support and resistance levels.
- Shows standard and trailing stop levels.
- Creates a competitive advantage.
Drawbacks associated with imbalance
- Automated tools are only available in the most advanced software.
- Demands a fast response.
- Constant presence and monitoring of the market is required.
- The tool is most effective for intraday trading.
Conclusions
Utilizing a footprint provides traders with an unparalleled opportunity to peer inside a bar and observe market activity as it happens. The footprint imbalance tool is a powerful, elegant, and contemporary approach to technical analysis in the cryptocurrency market. To get ahead of others, use the latest software and follow the trend, rather than resisting it.

