TRX and IMX Price Analysis as of February 15, 2024

As Bitcoin sustains its upward momentum, reaching a new two-year high at $52,500, we present a market analysis of Tron (TRX) and Immutable (IMX) for Thursday, February 15.
Tron (TRX)
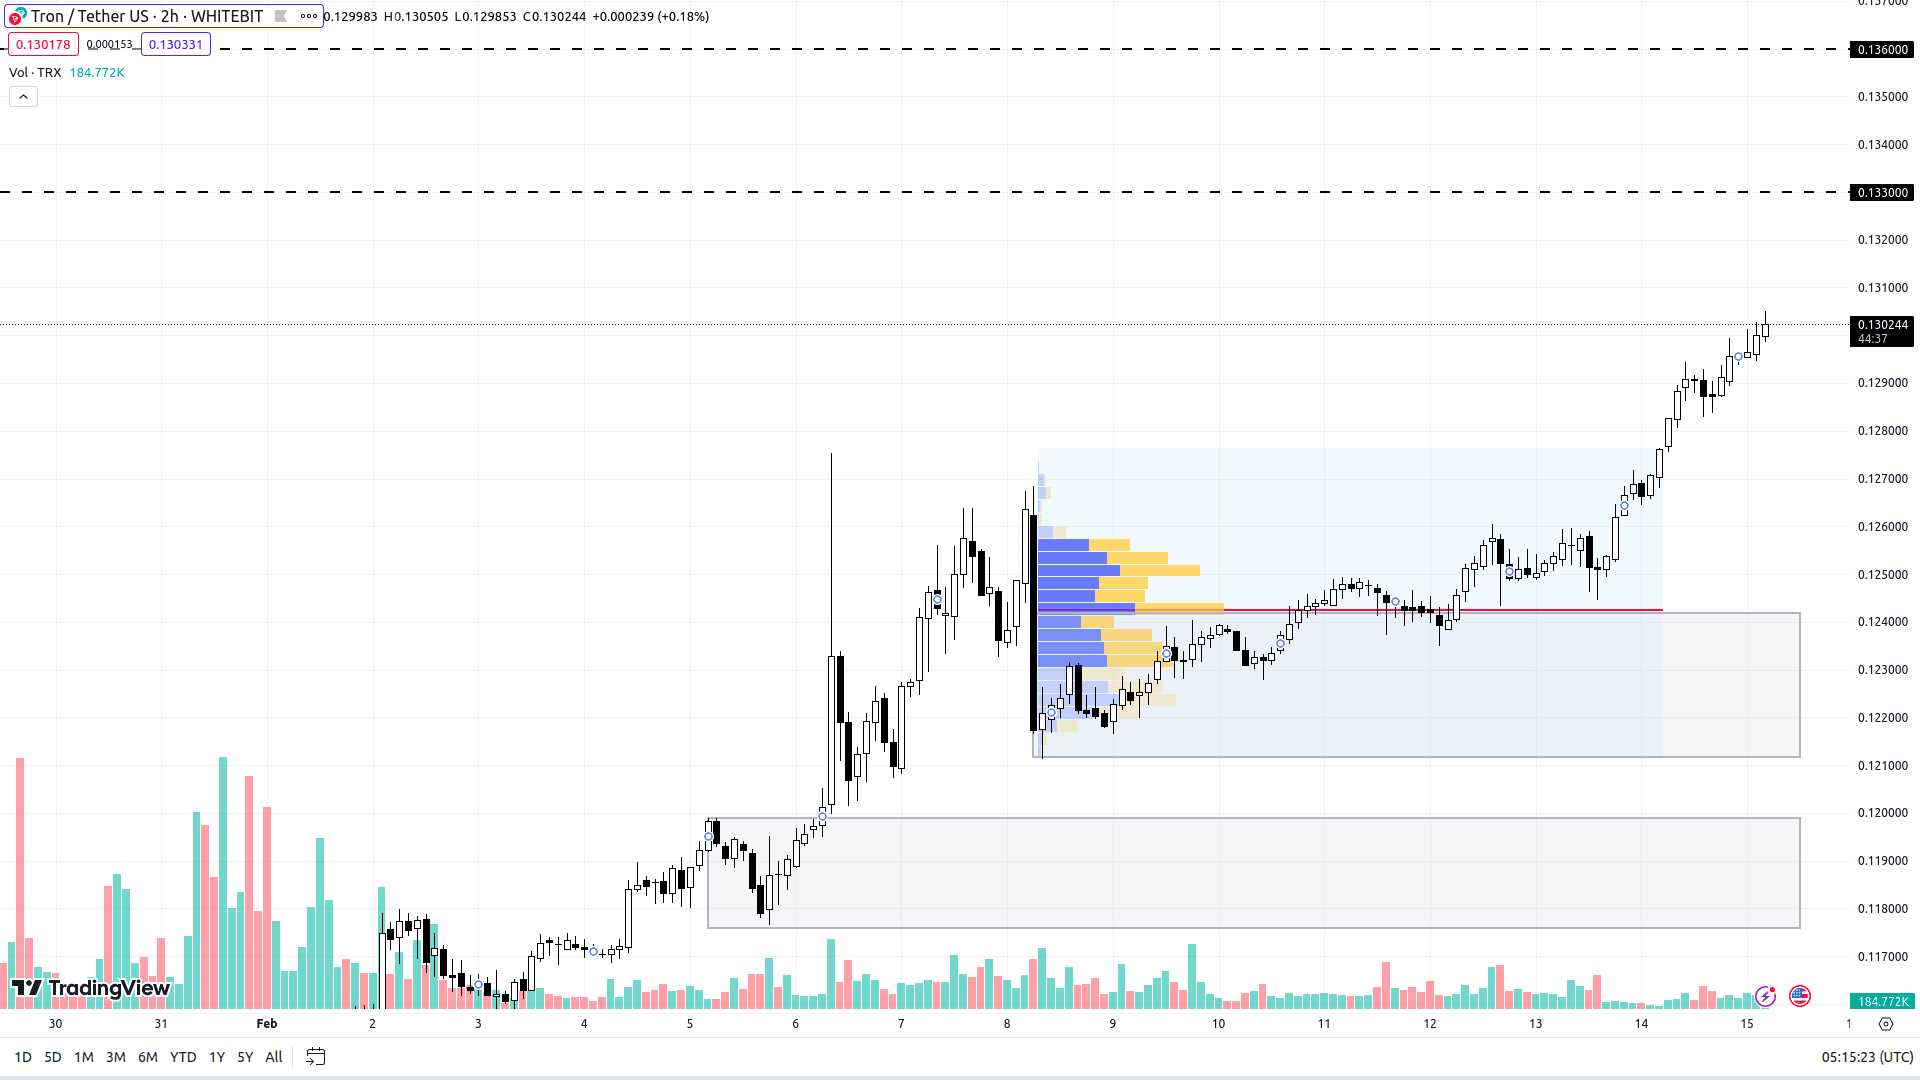
For the past four months, TRX has been in an ascending trend. This February 2024, the asset has risen by 15%, reaching a new annual high beyond the $0.13 mark. It's currently difficult to pinpoint any resistance level capable of curtailing this robust buyer momentum.
The market might first respond to sellers around the $0.133 and $0.136 levels. Nonetheless, without unexpected negative developments, these thresholds are also at risk of being swiftly surpassed, thus becoming irrelevant. Therefore, engaging in short positions for this asset is generally discouraged.
If TRX undergoes a correction, the zones at $0.121–$0.124 and $0.117–$0.120 are seen as potential areas for buyer orders, making them suitable entry points for long positions. A shift to a downward trend could only realistically occur if Bitcoin falls below $44,500.

TRX H2 Chart
Immutable (IMX)
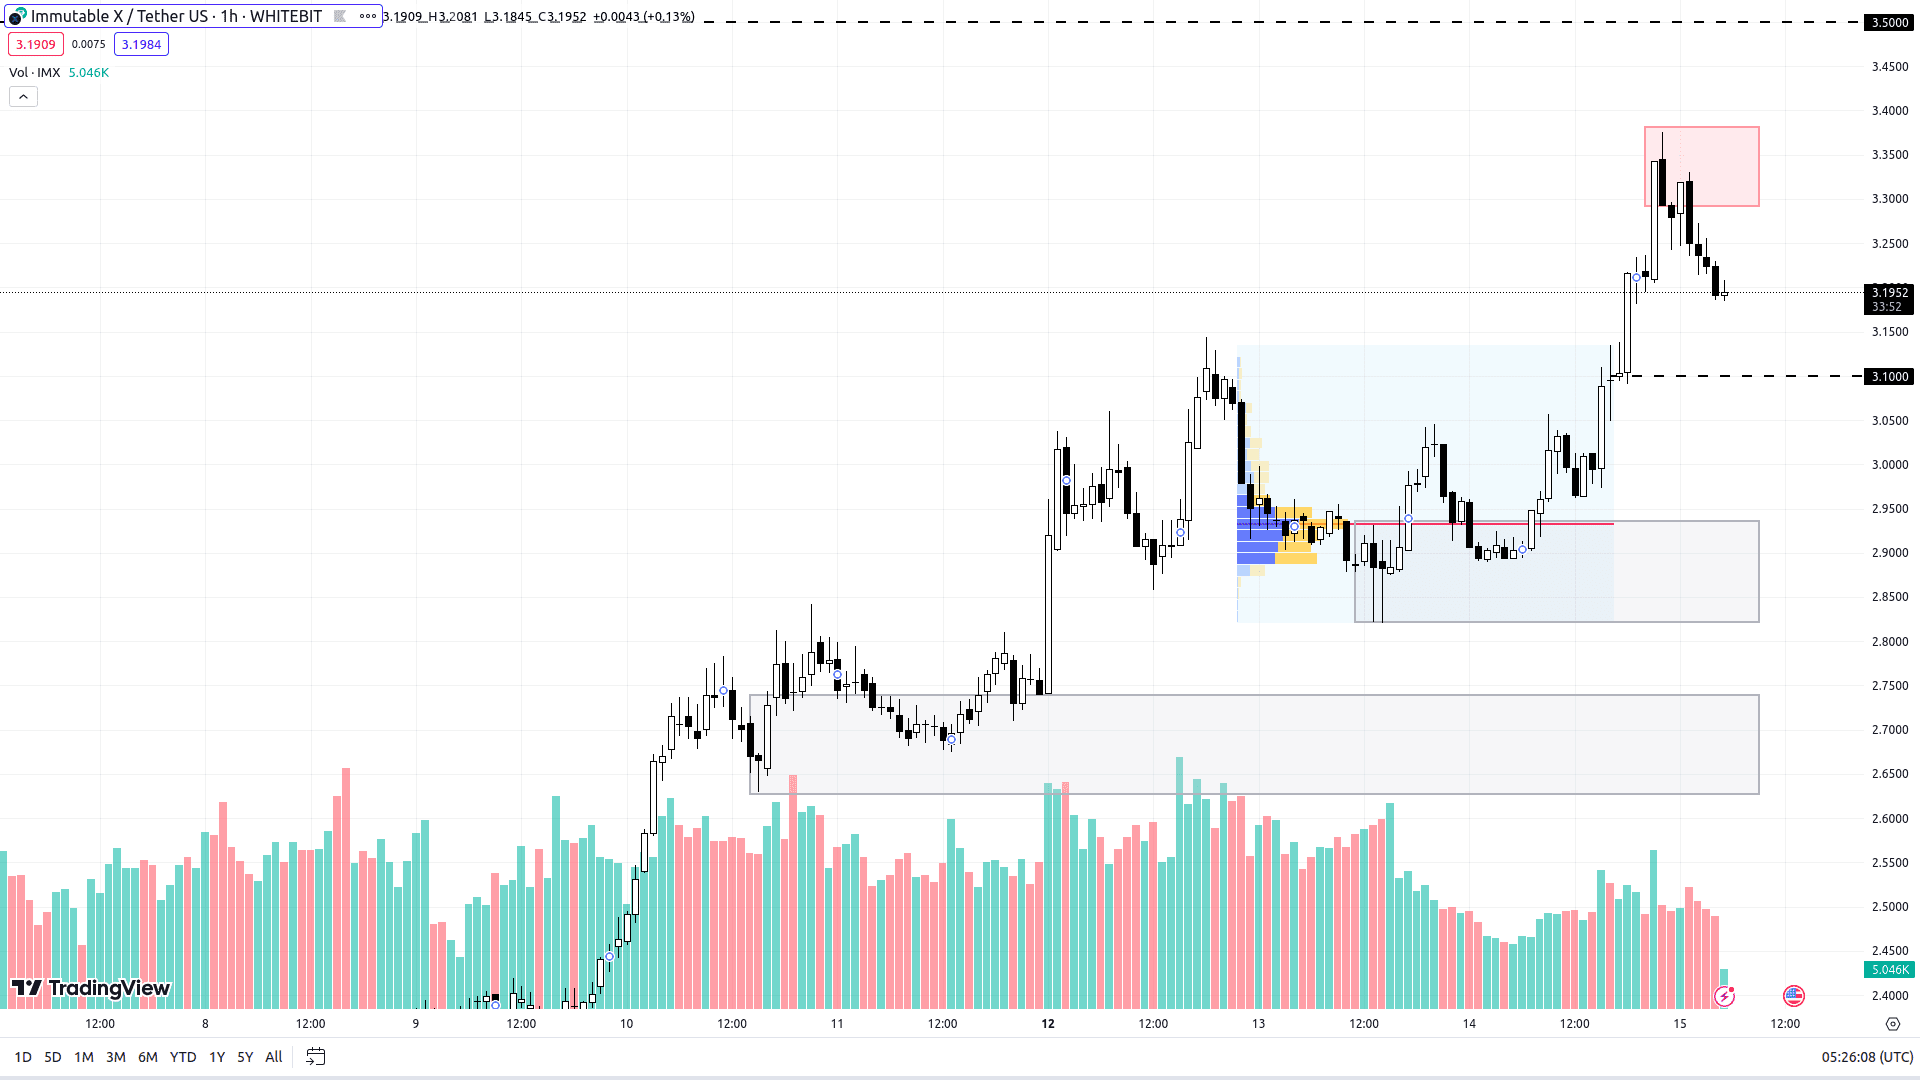
Since January 22, the coin has seen almost a 100% increase in value, now trading at around $3.2. The immediate resistance is identified within the $3.29–$3.38 zone.
Overcoming this range would likely prolong IMX's bullish journey, with buyers next aiming for the $3.5 level—a height the coin hasn't reached in two years.
A correction currently seems improbable. Buyer orders are notably present at the $3.1 level. Should prices fall, support zones at $2.82–$2.93 and $2.62–$2.74 could offer stability. Similar to TRX, IMX is expected to mirror any significant movements in Bitcoin's trajectory, including downturns.

IMX H1 Chart
Check out GNcrypto for the latest cryptocurrency rates and chart analysis.
Disclaimer
Please note that the analysis provided above should not be considered a trading recommendation. Before opening any deals, we strongly advise conducting your own research and analysis.
Abbreviations
TF (Timeframe) — a chronological period equal to the time it takes to form one Japanese candle on the chart.
Horizontal channel (flat, sideways, range) — the price movement between support and resistance levels, without going beyond the given range.
К — simplified designation of one thousand dollars of the asset price (for example, 23.4K – $23,400).
Gray range on the chart — a support zone.
Red range on the chart — a resistance zone.
Correlation — the tendency of prices of different cryptocurrencies to move in sync, often influenced by the dominance of one of the assets.
Initial materials
This analysis was informed by the following educational materials and articles from GNcrypto:
Recommended

