UNI and LDO Altcoin Analysis for November 23, 2023

Bitcoin maintains a sideways trend, holding firm above $37,000 with low volatility. Here's a review of the market situation for Uniswap (UNI) and Lido DAO (LDO) as of Thursday, November 23.
Uniswap (UNI)
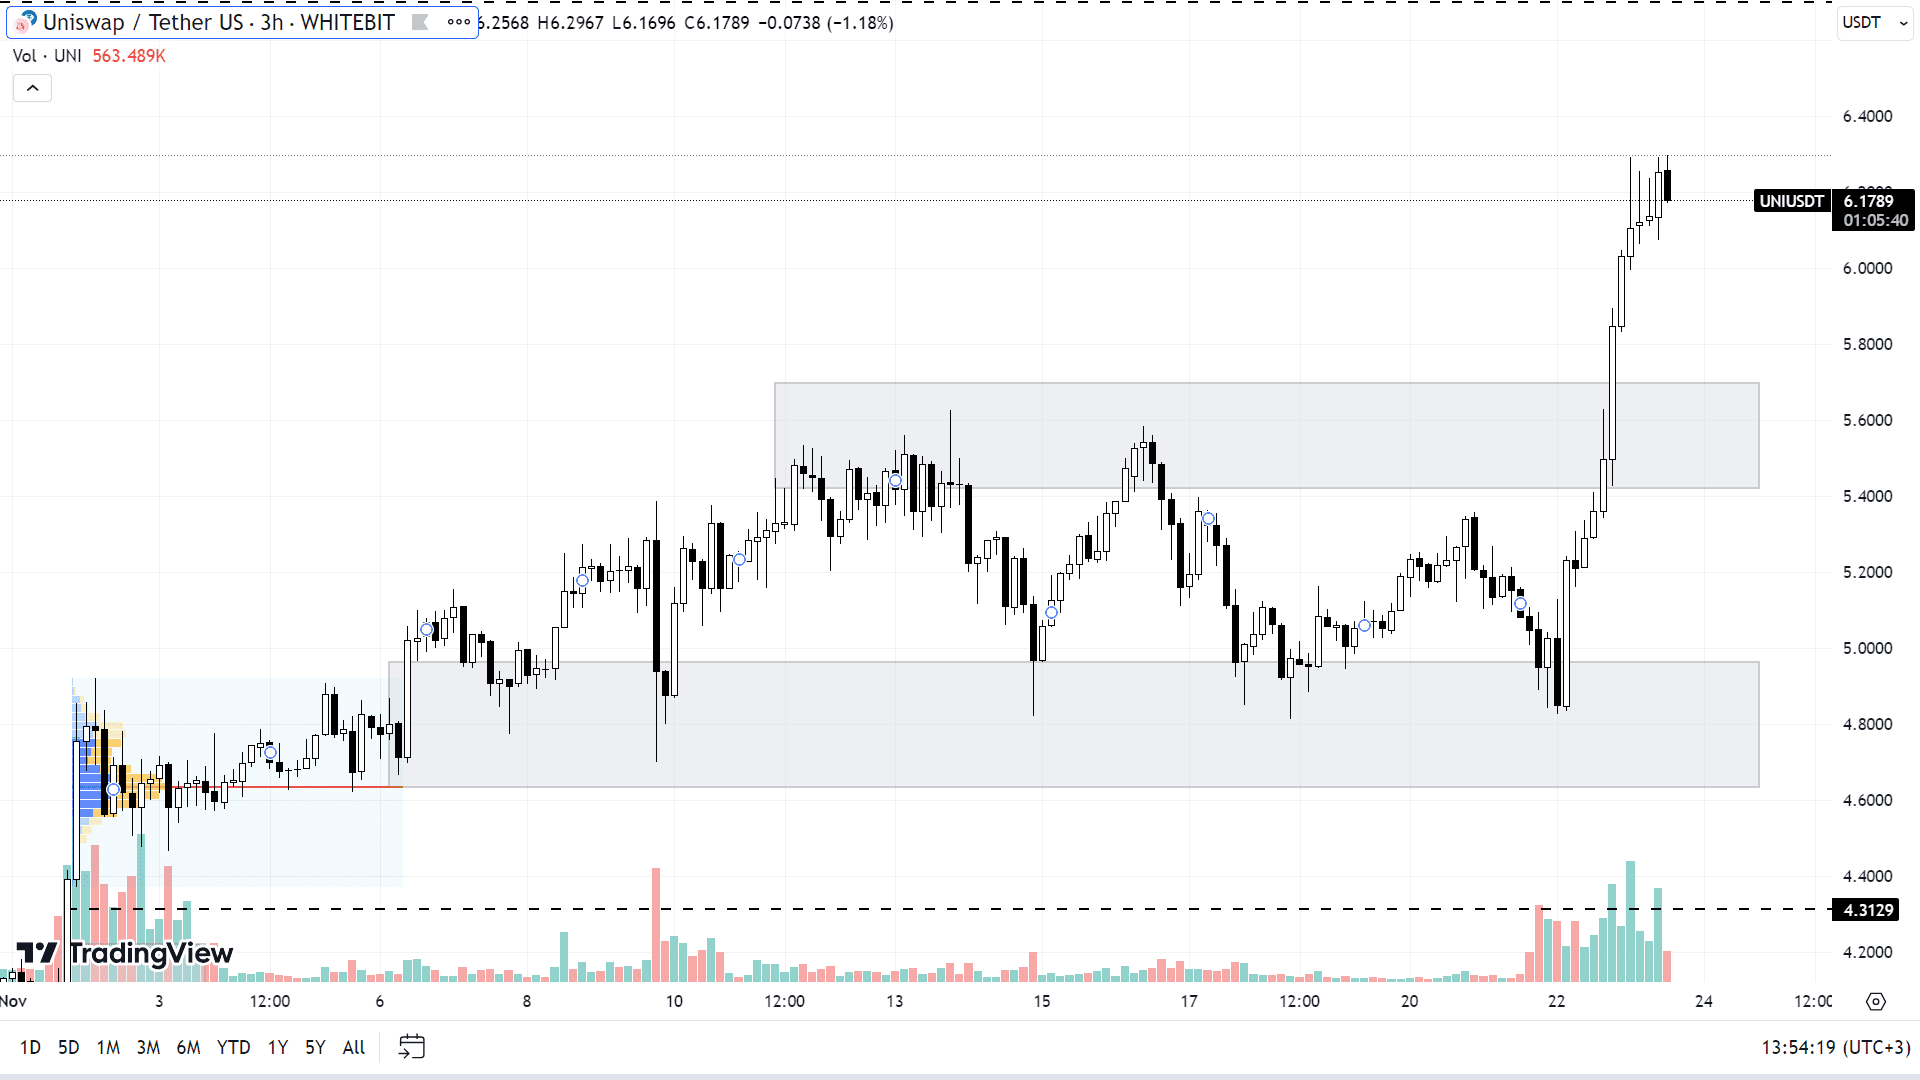
UNI has been on an upward trajectory. Since November 16, the asset has appreciated by 60%, with a notable increase from $4.85 to $6.30 (+25%) in the past two days.
With Bitcoin's chart showcasing an upward trend, the continued growth of the UNI token remains a likely scenario. In the upcoming days, buyers can try and surpass the annual high and challenge the $6.7 resistance level. However, this requires the asset's price to first consolidate above the $6 mark.
Should a correction occur, UNI might fall to support zones around $5.4-$5.7, $4.6-$5, and $4.31. Placing limit orders for buying the asset might be risky, as Uniswap token, along with other altcoins, could suffer from liquidity shortages in the event of a significant drop in BTC. This situation could lead to the asset's price plunging well below these support levels.

UNI chart on the H3 timeframe
Lido DAO (LDO)
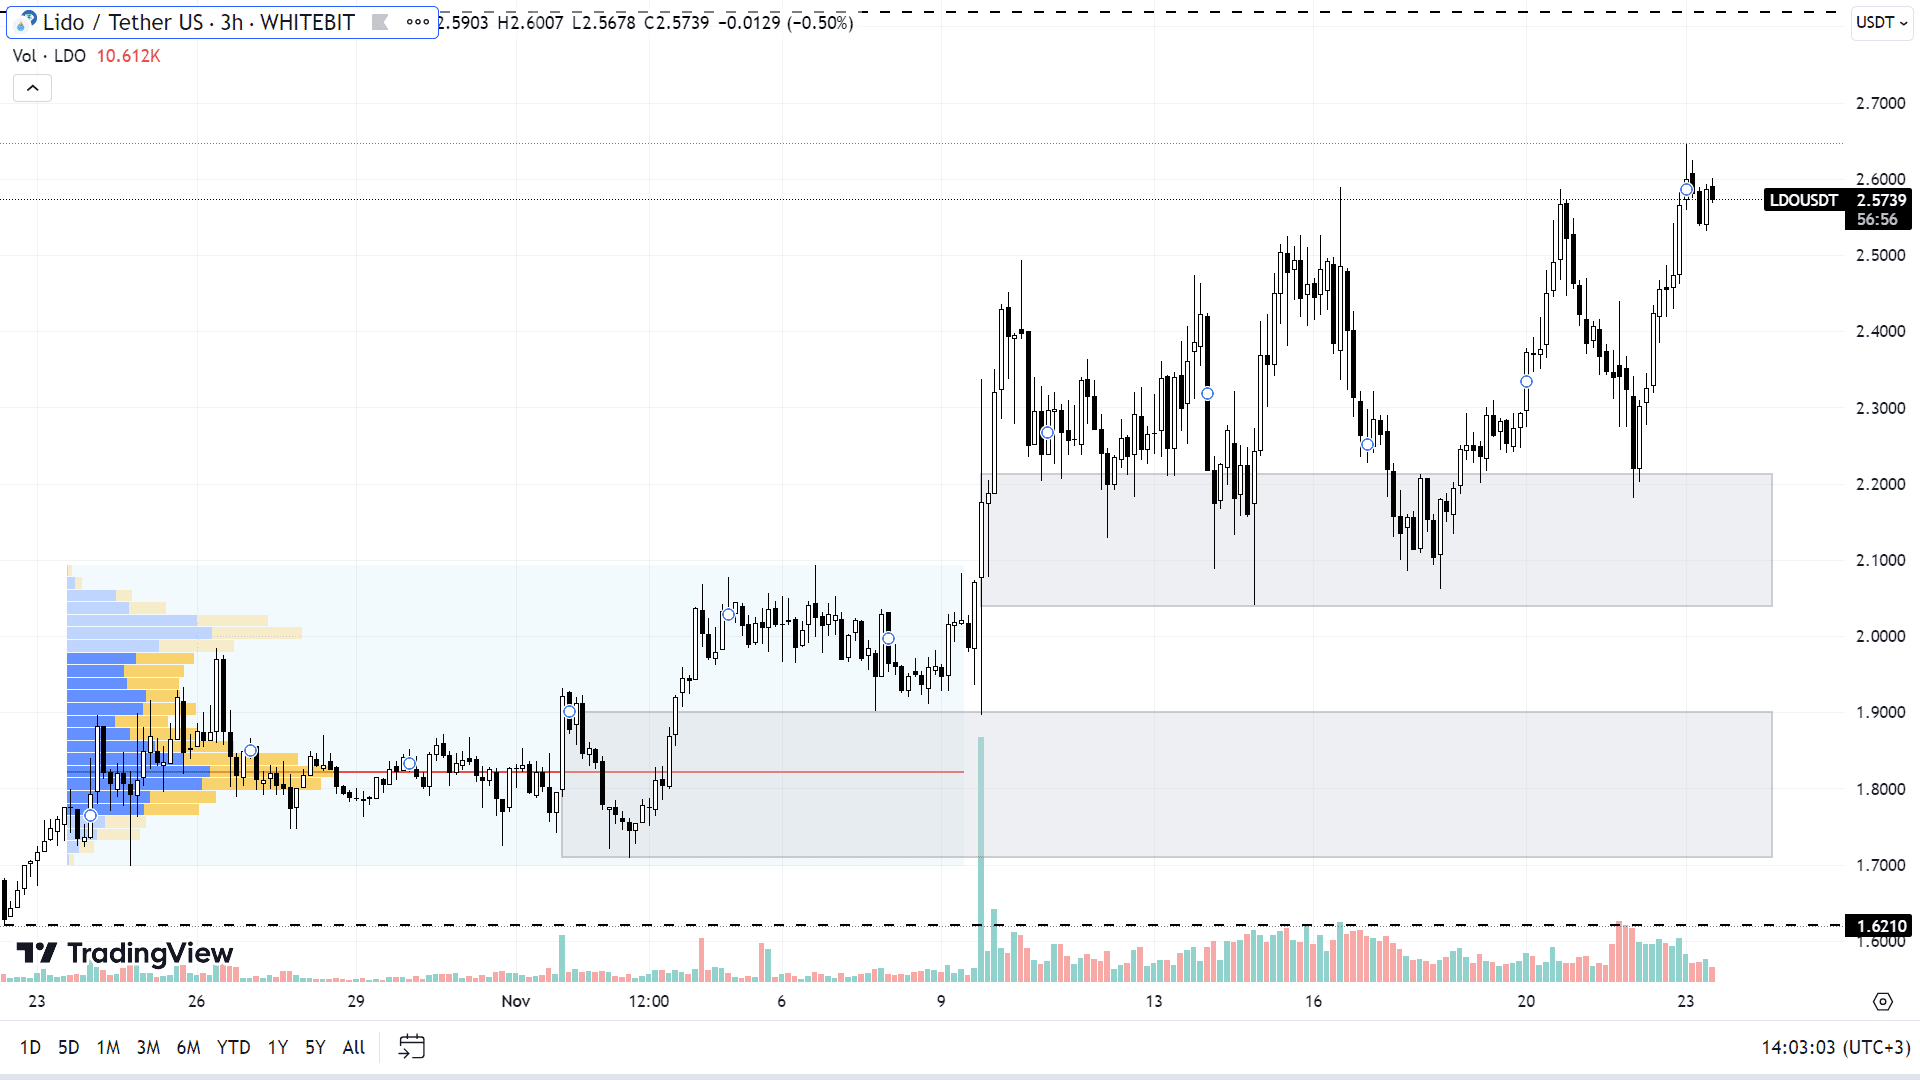
LDO continues to exhibit an upward trend. In the last one and a half months, the asset has appreciated by 80%, setting a new local high at the $2.64 mark.
Identifying a robust resistance level for LDO is surprisingly difficult due to its consistent achievement of new highs. The next potential target for buyers could be around the $2.81 level, with a further psychological milestone at $3.
Given the continued growth of BTC and ETH, a significant drop in the LDO price seems improbable at this stage. Should there be a temporary market correction, the asset's price might retreat to the support zone ranging from $2.03 to $2.21, or possibly to the $1.7-$1.9 range, with a key buyer's level at $1.62.

LDO chart on the H3 timeframe
Check out GNcrypto for the latest cryptocurrency rates and chart analysis.
Disclaimer
Please note that the analysis provided above should not be considered a trading recommendation. Before opening any deals, we strongly advise conducting your own research and analysis.
Abbreviations
TF (Timeframe) — a chronological period equal to the time it takes to form one Japanese candle on the chart.
Horizontal channel (flat, sideways, range) — the price movement between support and resistance levels, without going beyond the given range.
К — simplified designation of one thousand dollars of the asset price (for example, 23.4K – $23,400).
Gray range on the chart — a support zone.
Red range on the chart — a resistance zone.
Correlation — the tendency of prices of different cryptocurrencies to move in sync, often influenced by the dominance of one of the assets.
Initial materials
This analysis was informed by the following educational materials and articles from GNcrypto:
Recommended

