XRP and ADA: Altcoin Analysis for January 12, 2024

Bitcoin recently hit a new local high at $48,900, followed by a minor correction, now hovering around $46,000. This update provides an analysis of the market situation for altcoins Ripple (XRP) and Cardano (ADA) as of Friday, January 12.
Ripple (XRP)
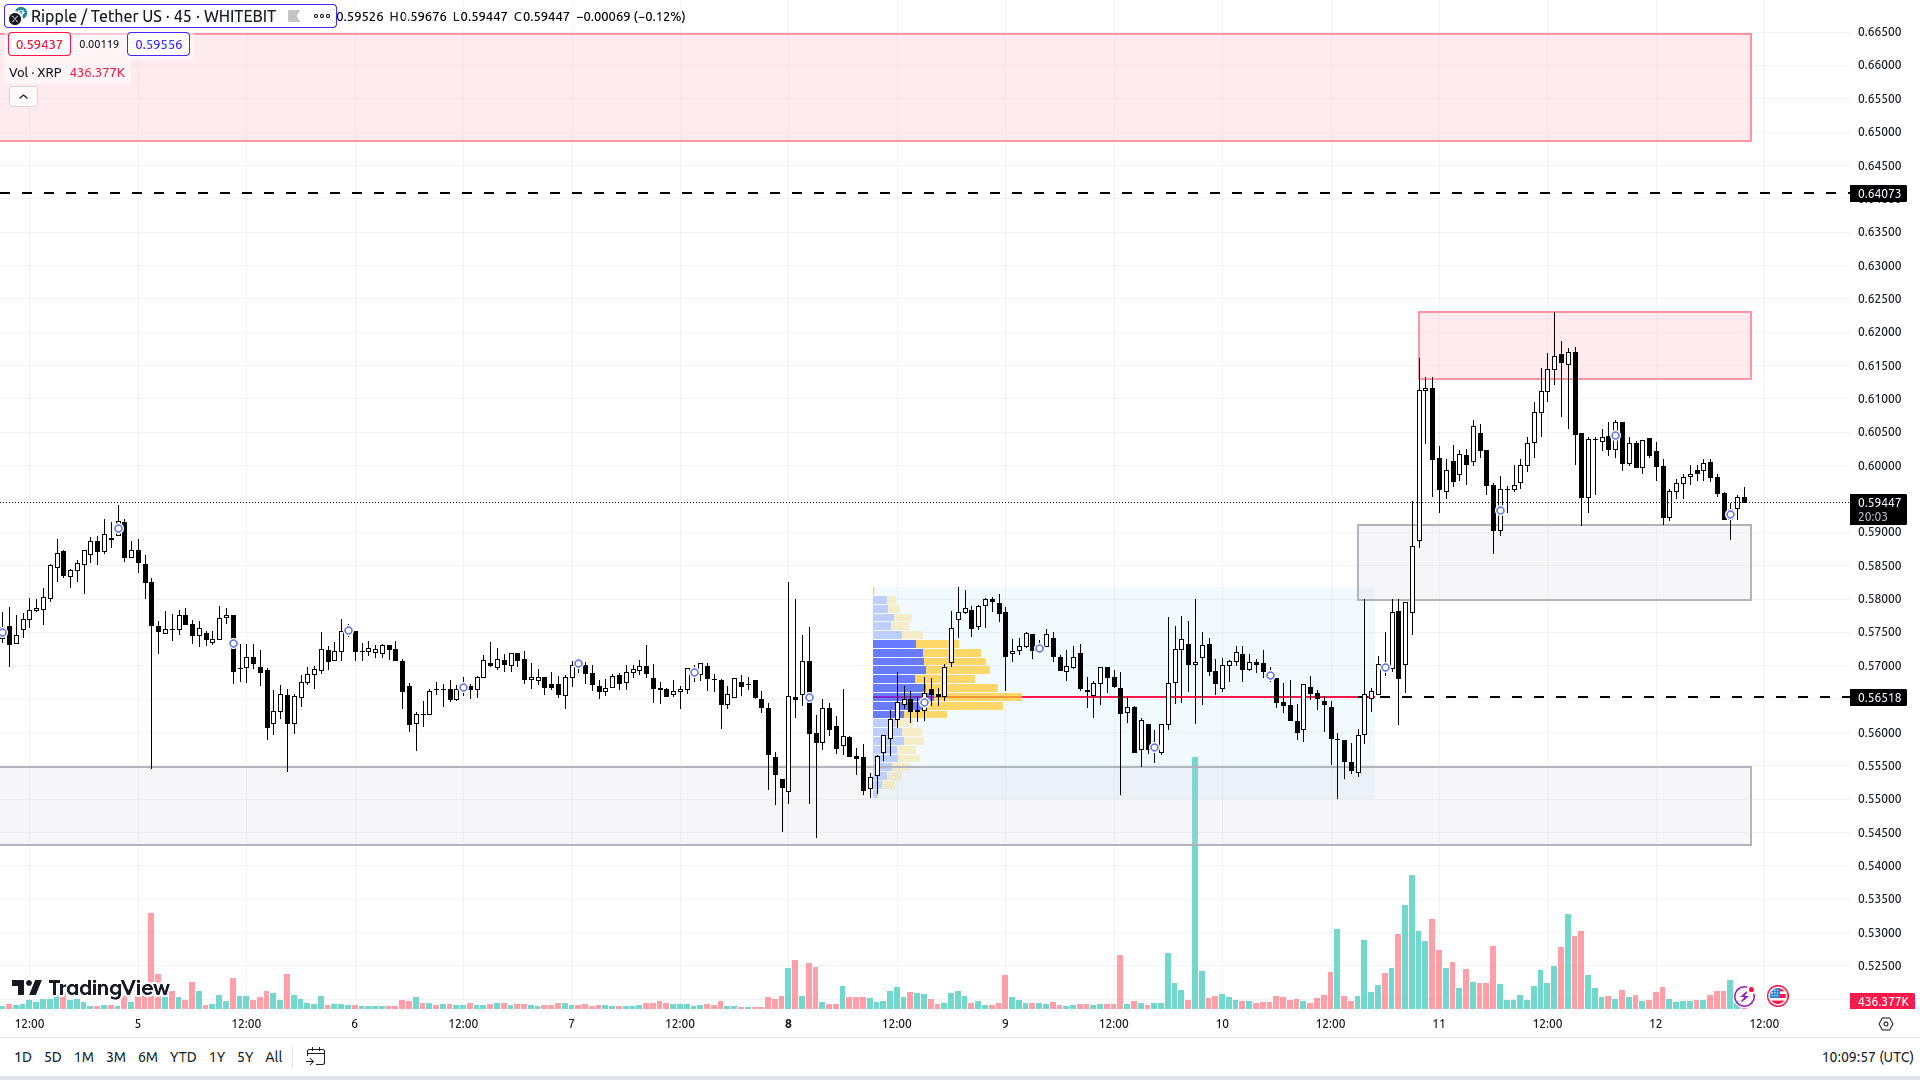
While the current trend for XRP is upward, its pace of growth seems somewhat slow and tentative. The coin is trading between a support zone of $0.58–$0.59 and a resistance zone of $0.61–$0.62.
Considering the ongoing positive trajectory of BTC, a further rise in Ripple’s value seems more likely. Breaking past the resistance zone could lead the price towards $0.640 and then the $0.650–$0.664 range. However, reaching a new local high remains unlikely at the moment.
If a downturn occurs, XRP’s price might negate its October-December 2023 growth and test support zones at $0.565 and $0.543–$0.554.

XRP chart on the M45 timeframe
Cardano (ADA)
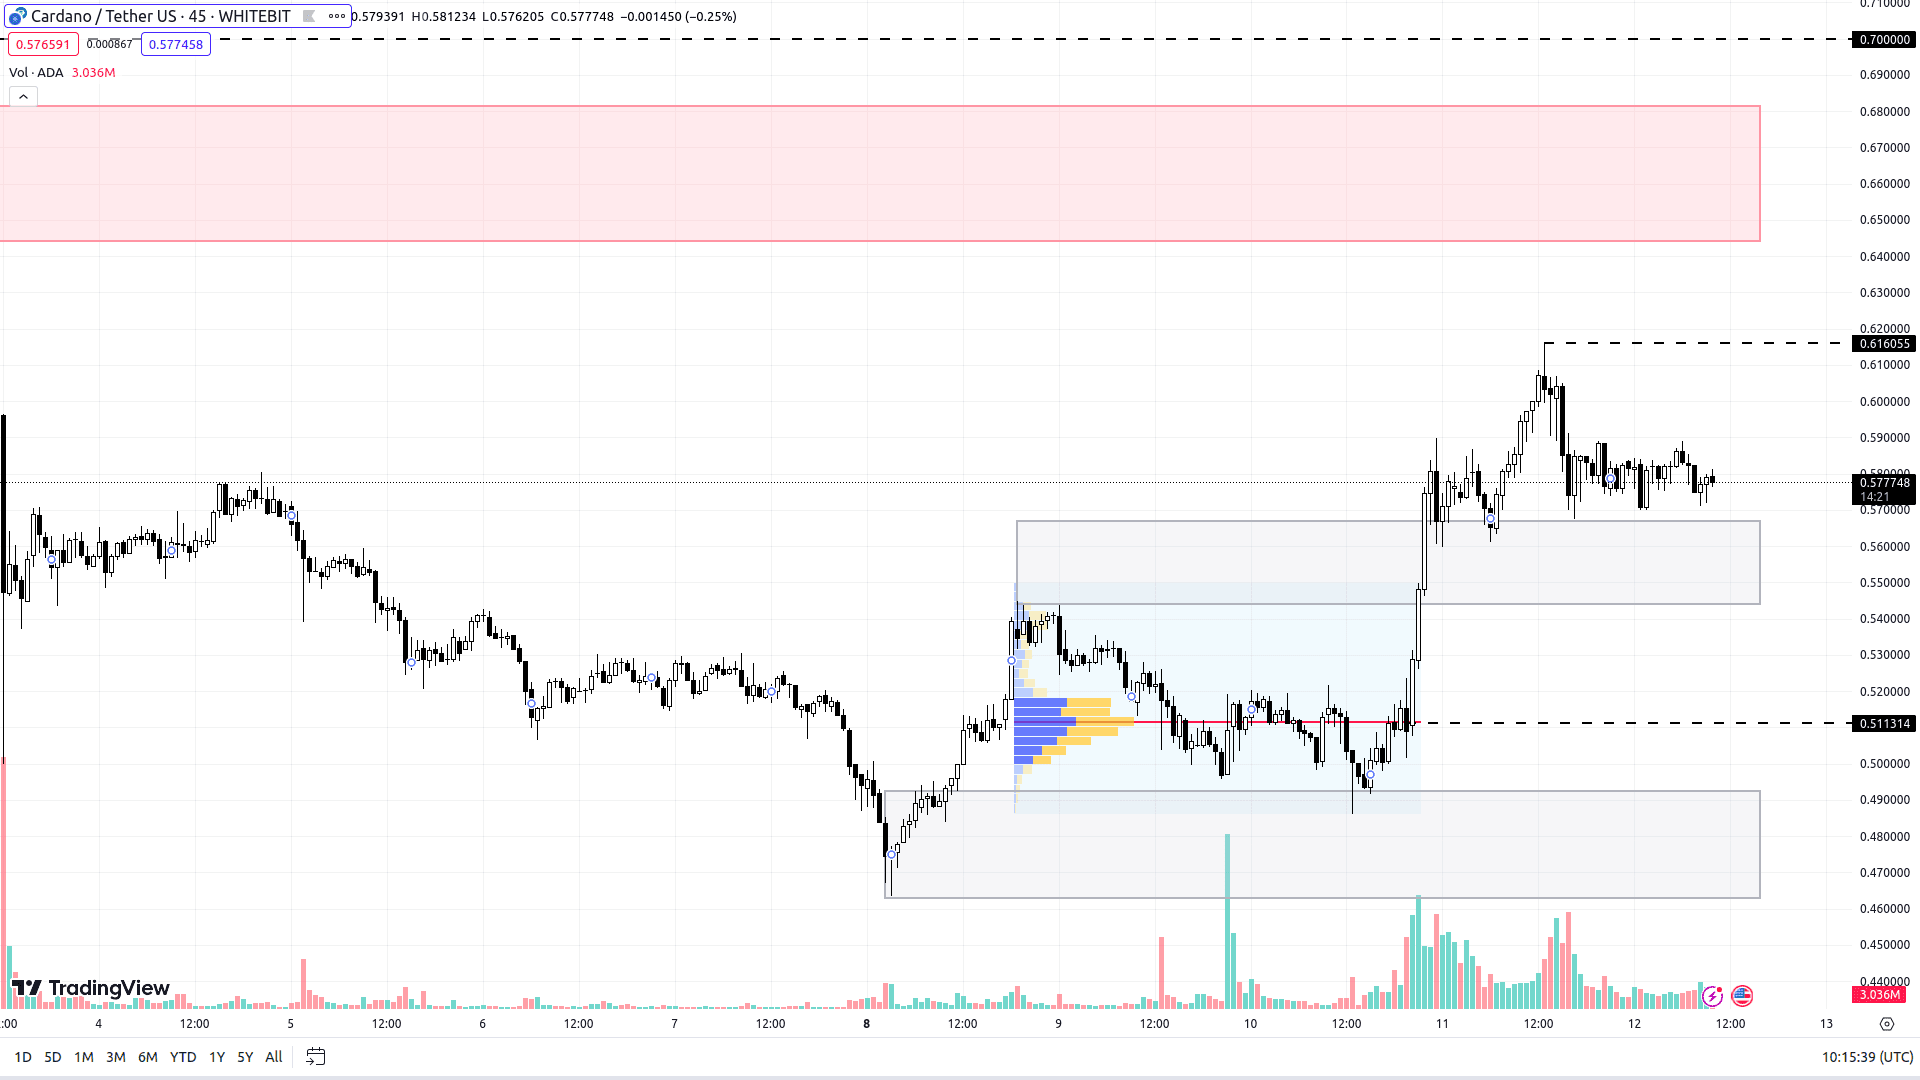
The market trend for ADA remains positive, with the asset trading between a buyer's zone of $0.544–$0.566 and a resistance level of $0.616.
Similar to Ripple, continued growth seems to be the most probable scenario for Cardano. The coin could surpass the current seller's level and approach the resistance zone of $0.644–$0.691, even testing the local high around $0.700.
Should BTC’s chart show a decline, ADA is likely to be affected similarly. Below its current support range, the buying zones of $0.511 and $0.462–$0.492 might see increased activity.

ADA chart on the M45 timeframe
The cryptocurrency market usually experiences calm weekends with minimal volatility, a trend expected to continue this time.
Check out GNcrypto for the latest cryptocurrency rates and chart analysis.
Disclaimer
Please note that the analysis provided above should not be considered a trading recommendation. Before opening any deals, we strongly advise conducting your own research and analysis.
Abbreviations
TF (Timeframe) — a chronological period equal to the time it takes to form one Japanese candle on the chart.
Horizontal channel (flat, sideways, range) — the price movement between support and resistance levels, without going beyond the given range.
К — simplified designation of one thousand dollars of the asset price (for example, 23.4K – $23,400).
Gray range on the chart — a support zone.
Red range on the chart — a resistance zone.
Correlation — the tendency of prices of different cryptocurrencies to move in sync, often influenced by the dominance of one of the assets.
Initial materials
This analysis was informed by the following educational materials and articles from GNcrypto:
Recommended

