BTC and SOL Price Analysis for October 17, 2023

While BTC recently soared past the pivotal $30,000 mark, it swiftly retreated to under $28,500. Dive into an in-depth review of Bitcoin (BTC) and Solana (SOL) as of October 17.
Bitcoin (BTC)
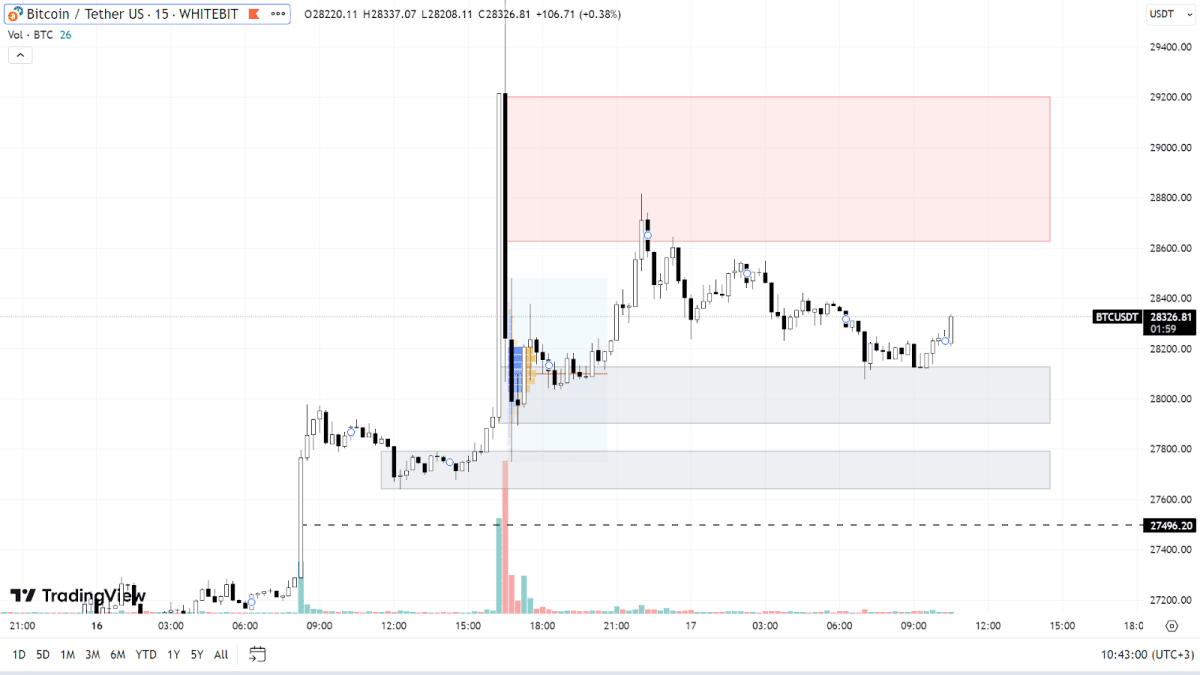
BTC experienced a dramatic rise, spurred by misleading news from Cointelegraph about the Bitcoin ETF approval. Within a mere 5-minute window, the asset's price surged by 7%, bulldozing several resistance levels and rendering them obsolete.
Seller orders are primarily clustered between the $28,600 and $29,200 marks. Beyond this range, resistance is found at $29,600 and the key $30,000 threshold. A resurgence in the BTC price will hinge on notable market optimism.
The current foundational support is pegged between $27,900 and $28,100. Further down, we find demand zones at $27,600-$27,800 and $27,500. Given the momentum and energy that buyers have poured into the recent surge, a pullback to these levels for BTC seems plausible.

BTC chart on the М15 timeframe
Solana (SOL)
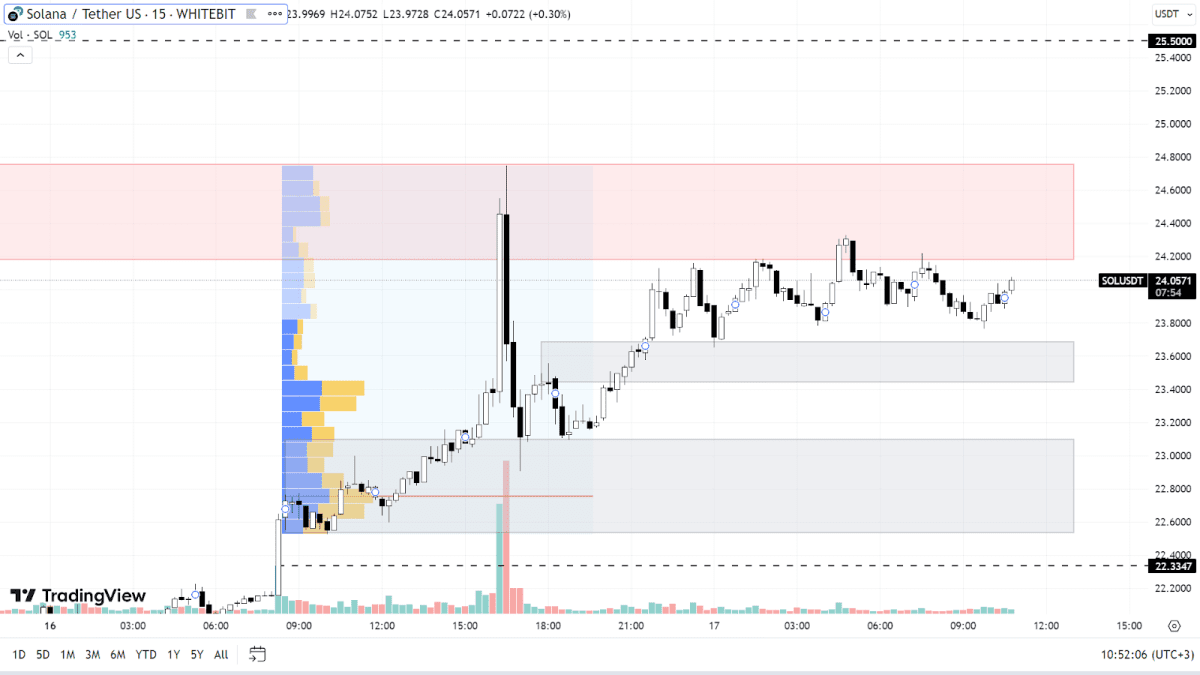
Solana continues its upward trajectory that began on September 12. Since then, the asset has appreciated by 38%, reaching a local high of $24.74 yesterday.
Should the market sentiment stay neutral or veer towards positive developments, SOL's rise is poised to persist. This could see the coin hitting and potentially exceeding the $25.5 and $26.4 marks, values last observed in July this year.
While a minor pullback remains plausible, key support zones lie between $23.44-$23.68 and $22.5-$23.1. Further down, purchase orders are notably clustered around the $22.33 level. It's also worth noting the significant correlation between SOL and BTC, which traders should consider when making investment choices.

SOL chart on the М15 timeframe
Check out GNcrypto for the latest cryptocurrency rates and chart analysis.
Disclaimer
Please note that the analysis provided above should not be considered a trading recommendation. These are solely the opinions of the GNcrypto editorial board regarding the market situation. Before opening any deals, we strongly advise conducting your own research and analysis.
Abbreviations
TF (Timeframe) — a chronological period equal to the time it takes to form one Japanese candle on the chart.
Horizontal channel (flat, sideways, range) — the movement of price between support and resistance levels, without going beyond the given range.
К — simplified designation of one thousand dollars of the asset price (for example, 23.4K – $23,400).
Gray range on the chart — a support zone.
Red range on the chart — a resistance zone.
Correlation — the tendency of prices of different cryptocurrencies to move in sync, often influenced by the dominance of one of the assets.
Initial materials
This analysis was informed by the following educational materials and articles from GNcrypto:
Recommended

